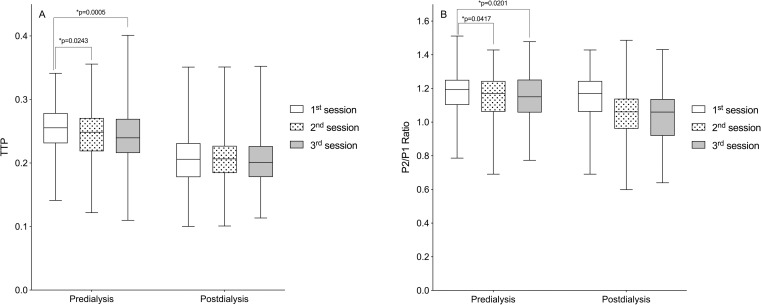
Fig 3. Comparison of predialysis and postdialysis noninvasive intracranial pressure (ICP) parameters according to the hemodialysis sessions over the six months of follow-up.
(A) Time to peak (TTP). (B) P2/P1 ratio. Box-plots illustrate the median and interquartile range of the noninvasive intracranial pressure parameters at the three weekly hemodialysis sessions (1st, 2nd, and 3rd) over the six months of follow-up (*p<0.05, repeated-measures ANOVA followed by the Tukey’s post-hoc test).

