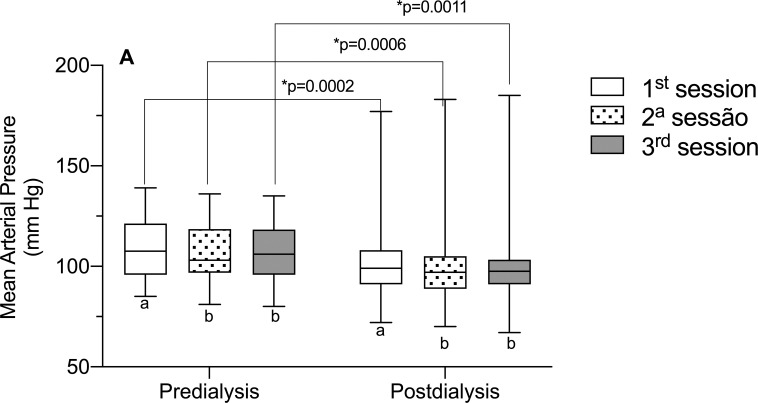
Fig 4. Mean arterial pressure in the different hemodialysis sessions of the week.
Significant statistical differences were observed for the mean arterial pressure (MAP) parameter when comparing it with the different hemodialysis sessions of the week (1st, 2nd, and 3rd). Different letters, significant differences between the different sessions in the pre- and post-dialysis moments (p<0.05, ANOVA for repeated measures and Tukey’s post-test).

