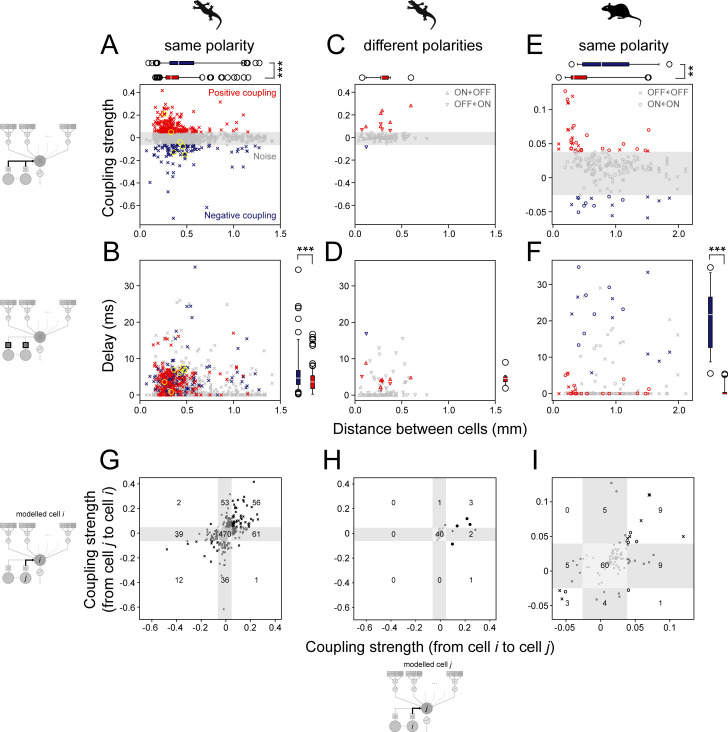
Fig 3. Coupling model predicts faster enhancing effects among proximal retinal ganglion cells and slower suppressing effects among distal cells.
(A, B) Coupling strength (A; ak in Eq (2) in Methods) and delay (B; lk in Eq (1) in Methods) parameter values from the LNSCN model plotted as a function of the distance between salamander retinal ganglion cells of the same response polarity (crosses, OFF cells coupled with OFF neighbors, N = 1460; yellow circles, representative cases in Fig 1B–1D). The noise level was determined by shuffling analysis (gray, 0.5 and 99.5 percentile; see Methods for details). Positive couplings (red, N = 211) were found at a shorter distance (A; 0.31±0.14 mm versus 0.40±0.26 mm; median ± interquartile range as shown by the box plot; p<0.001, rank-sum test) with a shorter latency (B; 3.5±3.6 ms versus 4.6±4.0 ms; p<0.001) than negative couplings (blue, N = 98). (C, D) Corresponding figure panels for salamander cells with different response polarities (down-pointing triangles, OFF cells with ON neighbors, N = 47; up-pointing triangles, ON cells with OFF neighbors, N = 46). Couplings above the noise level were mostly positive (N = 10) with the distance of 0.28±0.08 mm (C; median ± interquartile range) and the latency of 4.2±1.5 ms (D). (E, F) Corresponding figure panels for mouse retinal ganglion cells of the same response polarity (circles, ON cells coupled with ON cells, N = 76; crosses, OFF cells coupled with OFF cells, N = 116). Positive couplings (red, 18 ON and 15 OFF cell pairs) were found at a shorter distance (C; 0.33±0.25 mm versus 0.78±0.74 mm; p = 0.002) and with a shorter latency (D; 0.0±0.0 versus 21.9±13.8 ms; p<0.001) than negative couplings (blue, 7 ON and 9 OFF cell pairs). Data not analyzed for the mouse cells with different response polarities because the coupled model performance did not show an improvement (Fig 2B). (G–I) Comparison of the coupling strengths from one cell to another and vice versa (black, couplings above the noise level in both directions; dark grey, above the noise level only in one direction; light gray, both below the noise level). The number of data points in each category is shown in the figure panels. Symmetric, either mutually positive or negative, couplings were found more frequently than expected in both salamander (G, between cells of the same response polarity; H, between cells with different response polarities) and mouse (I, between cells of the same response polarity) retinas (p<0.001 in all three cases, χ2-test with df = 4). In G and I, crosses indicate OFF cell pairs, and circles ON cell pairs. In H, each data point represents an ON-OFF cell pair.

