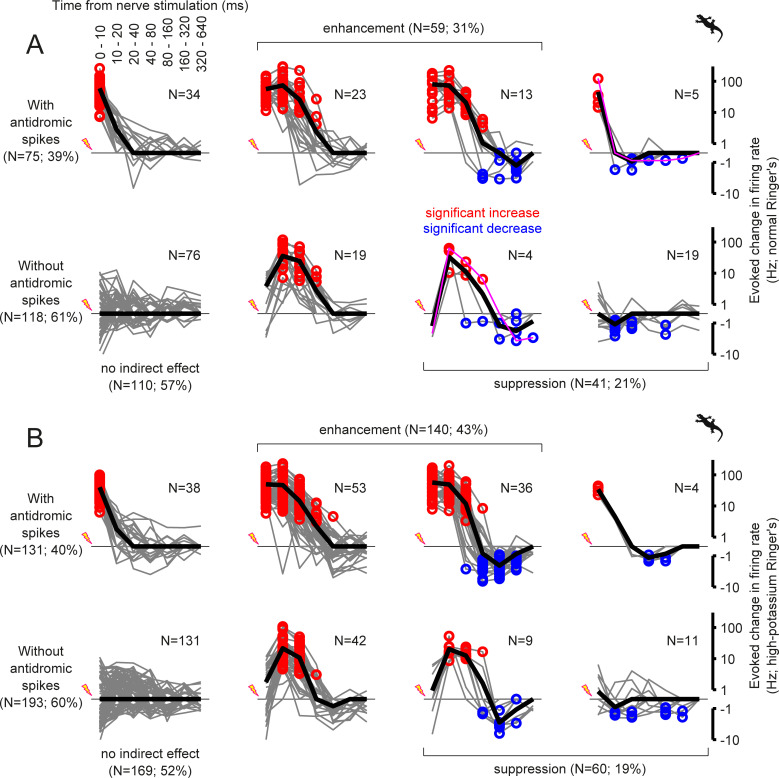
Fig 5. Intrinsic cellular property affects the fast excitation but not slow inhibition after the optic nerve stimulation.
Population data of the salamander retinal ganglion cell responses to the optic nerve stimulation in the normal (A) and high-potassium (B; 13 mM KCl) Ringer’s media, in the format of 2-by-4 contingency table. Each gray line represents the evoked change in the firing rate of a cell from its baseline (A, N = 193 in total; B, N = 324; red and blue circles, bins with significant increase and decrease, respectively, with Bonferroni correction), and the black line shows the mean over the cells in each group. In rows, the data were categorized by the presence (top; A, N = 75, B, N = 131; p = 0.5, χ2-test) and absence (bottom) of antidromic spikes. In columns, the data were categorized by the outcome of the nerve stimulation: first column, no indirect effect; second and third columns, enhanced firing after the nerve stimulation (A, N = 59; B, N = 140; p = 0.009); third and fourth columns, suppressed firing after the nerve stimulation (A, N = 41; B, N = 60; p = 0.8). The representative responses in Fig 4C and 4D are shown in magenta in A. The cut-off firing rate for the log-PSTH is ±0.5 Hz.

