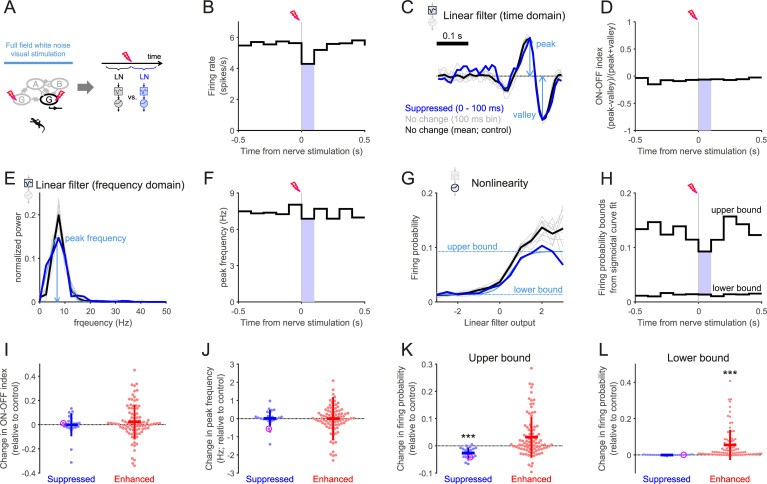
Fig 7. Negative feedback modulates the visual response gain but not the feature selectivity.
(A) Schematic diagram of the experiment and analysis. Full-field white-noise visual stimuli were presented together with the optic nerve stimulation (inter-stimulus intervals, 1–1.5 s) to probe changes in the LN model parameters at different time windows from the nerve stimulation (see B–H for example). The linear filter represents the stimulus feature selectivity of a cell, while the static nonlinearity indicates the visual response gain. (B) PSTH of a representative salamander ganglion cell with respect to the optic nerve stimulation during the visual stimulus presentation. Blue-shaded bins (0–100 ms after the nerve shock) indicate those in which the firing rate was significantly lower than the baseline response of the cell (500 ms window before the nerve stimulation). (C) Linear filters of the example cell obtained by the reverse-correlation methods (i.e., spike-triggered average stimulus) using the spikes in different time bins from the PSTH (748–1037 spikes/bin; blue, 0–100 ms bin with significantly lower firing rates from B; gray, all the other 100 ms bins without significant firing rate changes; black, baseline). (D) Polarity of the linear filters (C) quantified by an ON-OFF index (i.e., the difference between the peak and valley values divided by the sum of the two; Eq (4) in Methods). (E) Normalized power spectral density of the linear filters in C. (F) Peak frequencies of the linear filters, estimated by fitting a gaussian curve to the power spectra in E. (G) Static nonlinearity of the example cell, computed for each corresponding linear filter at different time bins (Eq (5) in Methods). A sigmoid function (Eq (6) in Methods) was fitted to quantify the nonlinear profile (e.g., light blue for the suppressed period at 0–100 ms after the nerve shock, with the upper and lower bounds of the cell’s firing probability in dotted horizontal lines). (H) The upper and lower bound dynamics of the example cell’s firing probability with respect to the time from the nerve shock. The cell’s response gain (upper bound) became lower during the period of suppressed firing, while the stimulus feature selectivity remained unchanged (D and F). (I, J) Summary of the changes in the ON-OFF indices (I) and the spectral peak frequencies (J) between the periods with and without significant firing rate changes after the nerve stimulation (blue, decrease N = 25; red, increase N = 94; magenta, the representative cells in B–H). The horizontal and vertical lines represent the mean and standard deviation, respectively. On average there was no significant difference from the baseline across population (p>0.3 for both cases in I and J, sign-test). (K, L) Summary of the changes in the sigmoid function parameters fitted to the nonlinearity. The upper bounds (K) significantly decreased during the period of suppression (blue, p<0.001, sign-test), but only marginally increased during the period of enhancement (red, p = 0.08). In contrast, the lower bounds (L) significantly increased during the enhancement (p<0.001) but remained the same during the suppression (p>0.5).

