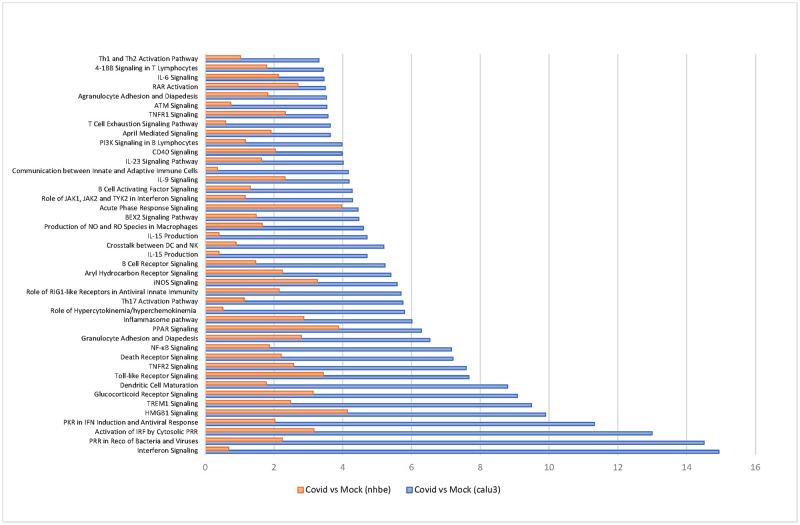
Fig 3. Pathway enrichment analysis from disease signatures (COVID-19 versus mock) in epithelial cell lines infected by SARS-CoV-2.
The top 40 most significantly dysregulated immunological canonical pathways in either the Calu-3 (yellow) and NHBE (brown) infected cell lines are represented in a radar plot according to -log (p-value). Pathway enrichment z-scores, based on fold change direction, represent predicted up-regulation (green dots) or down-regulation (blue dots) for positive or negative values, respectively.

