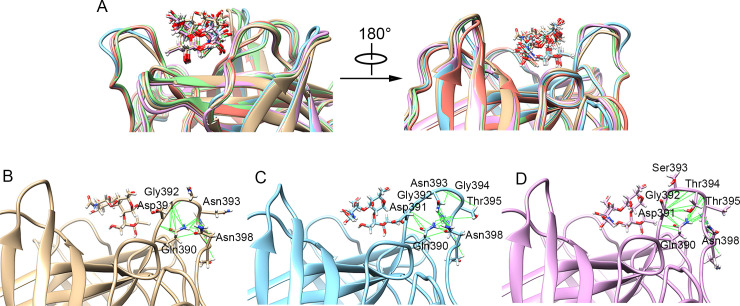
Fig 6. The conformational rearrangements of loop-2 for the various GII.4 strains binding to the receptor type A HBGA.
(A) The comparison of the conformations of loop-2 in the average P domain-HBGA complex structure of the MD simulations for the various studied GII.4 strains. The average P domain-HBGA complex structures of the MD simulations for the various strains were superposed by using the UCSF chimera software. The structures of the US95/96, Farmington Hills, Sydney, Hong Kong and GII.P16/GII.4 strains were displayed in gray, blue, purple, green and pink colors, respectively. (B-D) show the residue contacts in loop-2 analyzed by using the “Find Clashes/Contacts” tool of the UCSF Chimera software for the US95/96, Farmington Hills and Sydney strains, respectively.

