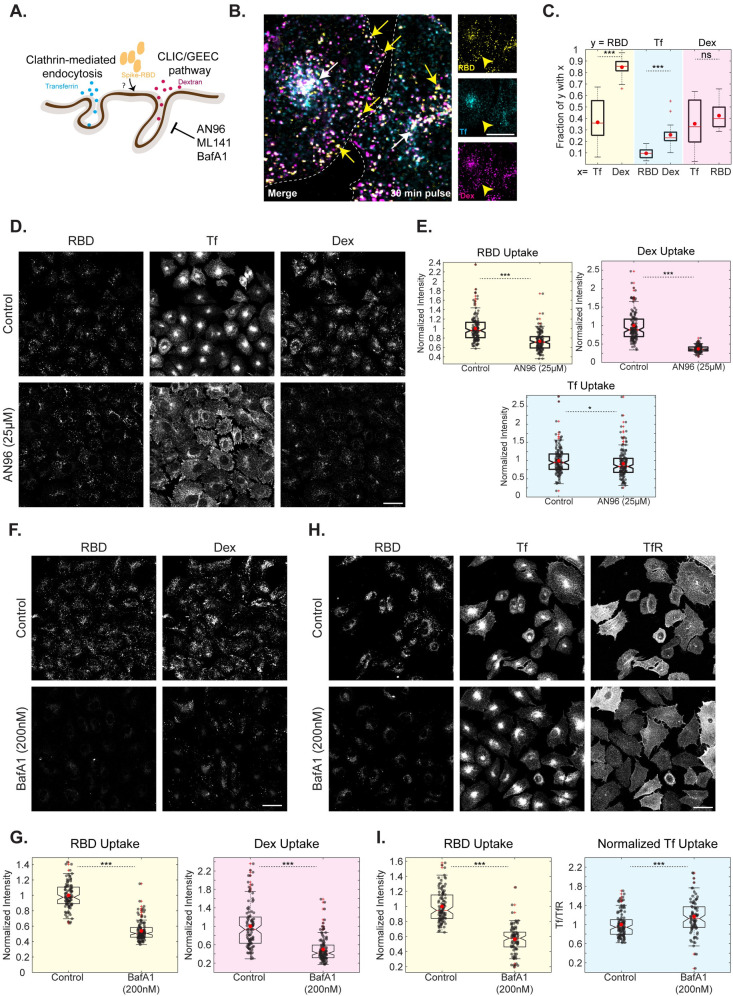
Fig 1. RBD uptake is sensitive to CG Pathway inhibitors in AGS cells.
A: Schematic describing endocytic pathways at the plasma membrane with specific cargoes for each endocytic pathway: transferrin (CME Cargo) and 10kDa dextran (CG Cargo). AN96, ML141 and BafA1 specifically affect the uptake of CG cargoes. B, C: AGS cells were pulsed with RBD, dextran and transferrin for 30 minutes and imaged at high resolution after fixation. Images are shown in B and quantification of Manders’ co-occurrence coefficient is shown in C. This compares the fraction of RBD endosomal intensity with transferrin or dextran (p-value < e-06), transferrin endosomal intensity with dextran or RBD (p-value < e-05) and dextran endosomal intensity with transferrin or RBD (p-value = 0.18). RBD is more co-localized to dextran endosomes. Number of cells = 10. White arrow represents endosomes containing RBD, dextran and transferrin. Yellow arrow represents endosomes with RBD and dextran without transferrin. Dashed white line in B represents the approximate cell boundary. D, E: AGS cells were pretreated with Control (0.6% DMSO) or AN96 25μM for 30 minutes and pulsed with RBD, dextran and transferrin for 30 minutes with or without the inhibitor. Treatment with AN96 reduces RBD (p-value < e-19) and dextran (p < e-44) uptake while minimally alters transferrin uptake (p = 0.02). Images are shown in D and quantification in E. Numbers of cells > 100 for each treatment. F, G: AGS cells were treated with Control (0.2% DMSO) or BafA1 200nM for 30 minutes and pulsed with RBD and dextran for 30 minutes with or without the inhibitor. Treatment with BafA1 reduces RBD (p-value < e-33) and dextran (p-value < e-18) uptake. Images are shown in F and quantification in G. Numbers of cells > 100 for each treatment. H, I: AGS cells were treated with Control (0.2% DMSO) or BafA1 200nM for 30 minutes and pulsed with RBD and transferrin for 30 minutes with or without the inhibitor. The surface transferrin receptor (TfR) was labelled after fixation. Treatment with BafA1 reduces RBD uptake (p-value < e-27) and increased normalized transferrin uptake (p-value < e-03). Images are shown in H and quantification in I. Numbers of cells > 80 for each treatment. Data (E, G, I) is represented as a scatter with box plot. Black dots represent per-cell data points. Box plot represents the distribution (25% to 75% percentile) with the red line indicating the median and red dot indicating the mean of the distribution. Whiskers represent distribution up to 1.5 times interquartile range and + indicates outliers beyond the whiskers. In the entire manuscript, ***, **, * and ns indicate p-value of Wilcoxon rank-sum test < 0.001, <0.01, <0.05 and not significant, respectively. Scale bar: 20μm (B) and 40μm (D, F, H).

