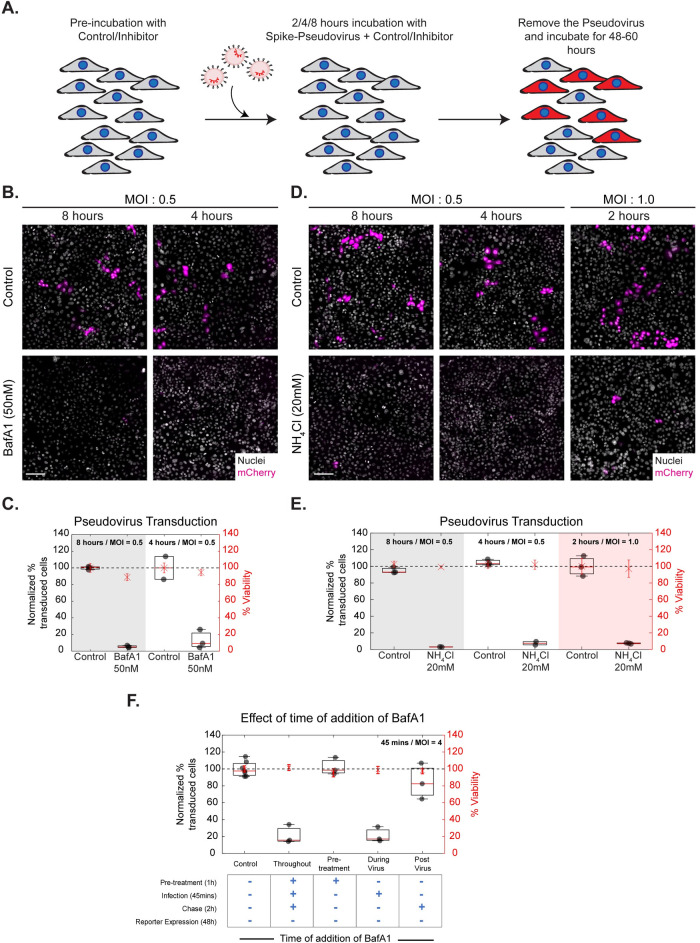
Fig 3. BafA1 and NH4Cl affect Spike-pseudovirus infection.
A: Schematic describing the experimental protocol for SARS-CoV-2 Spike-pseudovirus transduction assay. AGS cells were pre-incubated with the inhibitors (BafA1 50nM, NH4Cl 20mM, CQ 50μM) for an hour and transduced with Spike-pseudovirus at MOI 0.5 or MOI 1.0 for indicated incubation times. Following this, virus and inhibitor-containing medium was removed, and cells were further incubated with inhibitor-free media. B and D show images of AGS cells expressing the reporter mCherry protein and C and E show the quantification of normalized % transduction of cells treated with inhibitors compared to respective controls. B-E: Transduction efficiency is reduced with BafA1 (p-values < e-86 for 8 hours, < e-60 for 4 hours) and NH4Cl (p-values < e-83 for 8 hours, < e-72 for 4 hours, < e-85 for 2 hours) at all time points of incubation. Control in B is 0.05%DMSO and in D is 0%DMSO. Number of repeats ≥ 2 for each treatment. F: AGS cells were treated with control or BafA1, pre/during/post incubation with virus as well as throughout all three stages. BafA1 significantly reduces transduction when used throughout (p-value < e-63) as well as during virus presentation (p-value < e-59). Only pre-treatment or post-treatment of BafA1 does not significantly change the percentage of transduction. Number of repeats = 7 for control and 3 for each condition. Data (C, E, F) is represented as percentage transduction normalized to control on left Y-axis along with percentage viability, calculated from the total number of nuclei, normalized to control on the right Y-axis. Black dots represent the mean of each repeat. Box plot represents the distribution of the means (25% to 75% percentile) with red line indicating the median of the distribution. Asterix with error bars in red represents the mean +/- SD of % viability. Black dotted line marks 100%. Scale bar: 100μm (B, D).

