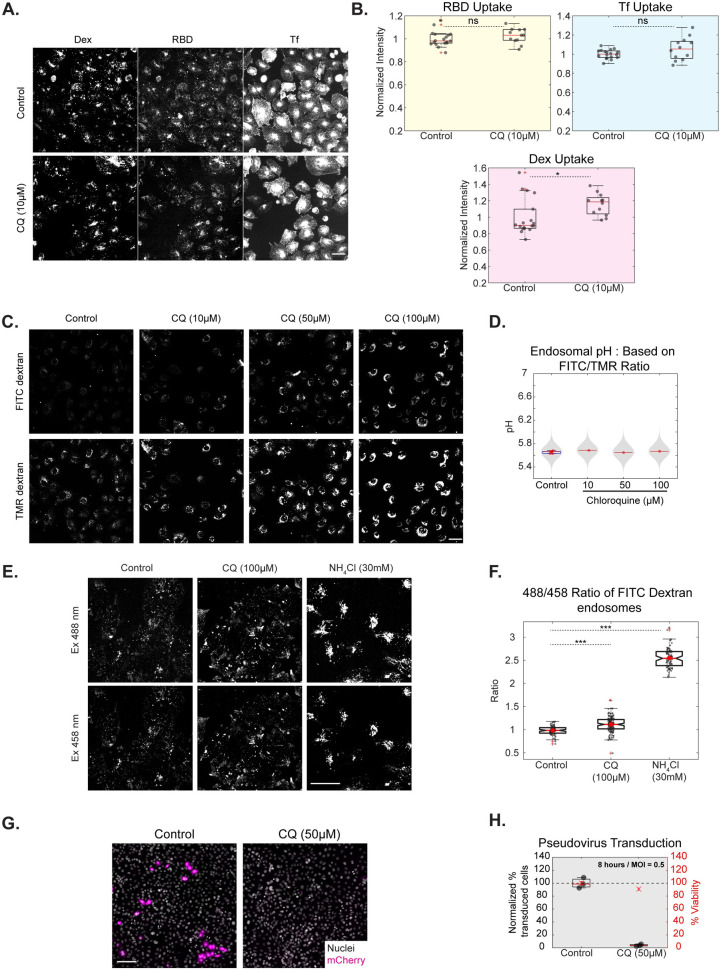
Fig 4. Chloroquine does not affect RBD uptake, minimally alters endosomal pH but affects Spike pseudovirus infection.
A, B: AGS cells were treated with Control (0% DMSO) or CQ 10μM for 30 minutes and pulsed with RBD, transferrin and dextran for 30 minutes with or without the inhibitor. Images shown in A and quantification in B show no change in the uptake of transferrin and RBD and marginal change in dextran uptake with CQ (p values = 0.2 for RBD, 0.24 for Tf, 0.013 for Dex). Box plot represents the distribution of medians of each repeat which is denoted by black dots. Number of repeats = 18 and 12 for Control and CQ, respectively and each repeat has >100 cells. C, D: AGS cells were pulsed with FITC and TMR dextran for 2 hours, chased for 1 hour with Control (0.2% DMSO), 10, 50 or 100μM of CQ and imaged live. CQ minimally alters the FITC/TMR ratio (p-value < e-23, 0.38 and < e-03 for 10, 50 and 100 μM of CQ, respectively). Numbers of cells in each condition is >150 cells. E, F: AGS cells pulsed with pH-sensitive (FITC) dextran for 2 hours and chased for 1 hour with Control or 100μM CQ or 15 minutes with 30mM NH4Cl and imaged live. CQ increases the 488/458 ratio of FITC dextran only slightly (p < e-10) compared to the increase brought about by NH4Cl (p-value < e-27). Images are shown in E and quantification in F. Number of cells > 75 for each treatment. G, H: Assay as described in 3A; Transduction efficiency is reduced with CQ with 8 hours of incubation (p-value < e-90). Number of repeats = 3 each for 0% DMSO Control and CQ. Data representation in B, D is as described in Fig 2; F as described in Fig 1; H as described in Fig 3. Scale bar: 40μm (A, C, E), 100μm (G).

