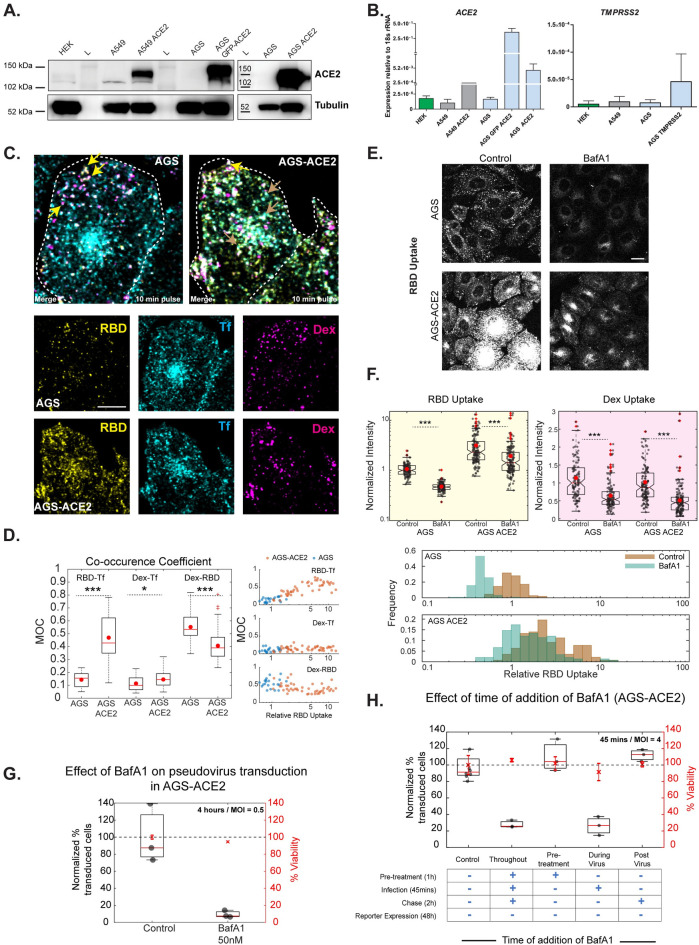
Fig 5. Effects of BafA1 on RBD uptake and Spike-pseudovirus transduction in AGS-ACE2 cells.
A: HEKs, A549 and AGS cell lysates were evaluated for expression of ACE2 protein. Lysates from A549 and AGS cells stably overexpressing ACE2 were also included. AGS cells do not show any detectable levels of ACE2 protein expression while HEKs and A549 cells express the protein. Tubulin expression was used as housekeeping control. B: Transcript profiling in HEKs, A549 and AGS cells indicates ACE2 (i) and TMPRSS2 (ii) expression at low levels in all three cell lines. Expression is reported in each line relative to its 18s rRNA levels. C, D: AGS and AGS-ACE2 cells were pulsed with RBD, dextran and transferrin for 10 minutes and imaged at high resolution after fixation. Images are shown in C and quantification of Manders’ co-occurrence coefficient is shown in D. This compares the occurrence coefficient between RBD and transferrin (p-value < e-08), transferrin and dextran and RBD (p-value = 0.04) and dextran (p-value < e-03) between the two cell types. RBD is more co-localized to dextran endosomes in AGS cells, RBD is co-localized to both dextran and transferrin endosomes in AGS-ACE2 cells. The correlation coefficient between RBD-Tf increases with RBD-uptake. Number of cells = 21 (AGS), 45 (AGS-ACE2). Yellow arrow represents endosomes containing RBD and dextran. Gray arrow represents endosomes with RBD and transferrin. Dashed white line in C represents the approximate cell boundary. E, F: AGS and AGS-ACE2 cells were treated with Control (0.4% DMSO) or BafA1 400nM for 30 minutes and pulsed with RBD and dextran for 30 minutes with or without the inhibitor. Treatment with BafA1 reduces RBD (p-value < e-37 in AGS, < e-10 in AGS-ACE2) and dextran (p-value < e-13 in AGS, < e-20 in AGS-ACE2) uptake in both cell types. Images are shown in E and quantification in F. Numbers of cells > 100 for each treatment. G: Transduction efficiency is reduced with 50nM BafA1 (p-values < e-75). Control is 0.04%DMSO. Number of repeats = 3 for each treatment. H: AGS-ACE2 cells were treated with control or 50nM BafA1, pre/during/post incubation with virus as well as throughout all three stages. BafA1 significantly reduces transduction when used throughout (p-value < e-67) as well as during virus presentation (p-value < e-68). Only pre-treatment or post-treatment of BafA1 does not significantly change the percentage of transduction. Number of repeats = 8 for control and 3 for each condition. Data representation in F is as described in Fig 1, G and H is as described in Fig 3. Scale bar: 10μm (C) and 20μm (E).

