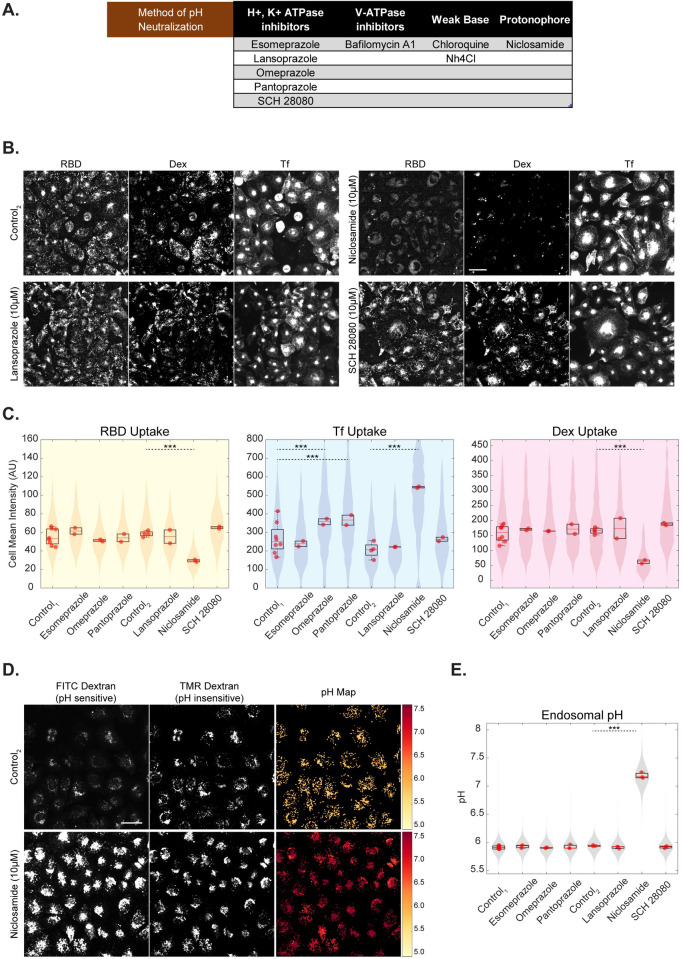
Fig 6. Identifying FDA-approved drugs functioning similar to BafA1 and NH4Cl.
A: Table describing various methods of altering endosomal pH along with the chosen subset of drugs to screen for entry and acidification inhibition B, C: High-throughput assay in which AGS cells were treated with an array of drugs at 10μM concentration for 30 minutes and pulsed with RBD, dextran and transferrin for 30 minutes. Niclosamide shows reduction in RBD (p-value < e-195) and dextran (p-value < e-133) uptake and increase in transferrin uptake (p-value < e-155). Omeprazole (p-value < e-34) and Pantoprazole (p-value < e-38) show an increase in transferrin uptake and minimally affects RBD or dextran uptake. Images are shown in B (and in S7A), quantification is shown in C and p-value table for all the inhibitor treatments is indicated in S1 Table. Control1 is 0% DMSO and Control2 is 0.3% DMSO. Number of repeats ≥ 2 for each treatment and each repeat has >80 cells. D, E: High-throughput assay in which AGS cells were pulsed with FITC and TMR dextran for 2 hours, chased for 1 hour with an array of drugs or control and imaged live. Endosomal pH increases upon addition of Niclosamide (p-value < e-110). Images along with pH maps are depicted in D (and in S7B), quantification is shown in E (and in S7C) and p-value table for all the inhibitors is indicated in S1 Table. Control1 is 0% DMSO and Control2 is 0.2% DMSO. Number of repeats ≥ 3 for each treatment and each repeat has >80 cells. Data representation in C and E is as described in Fig 2. Scale bar: 40μm (B, D).

