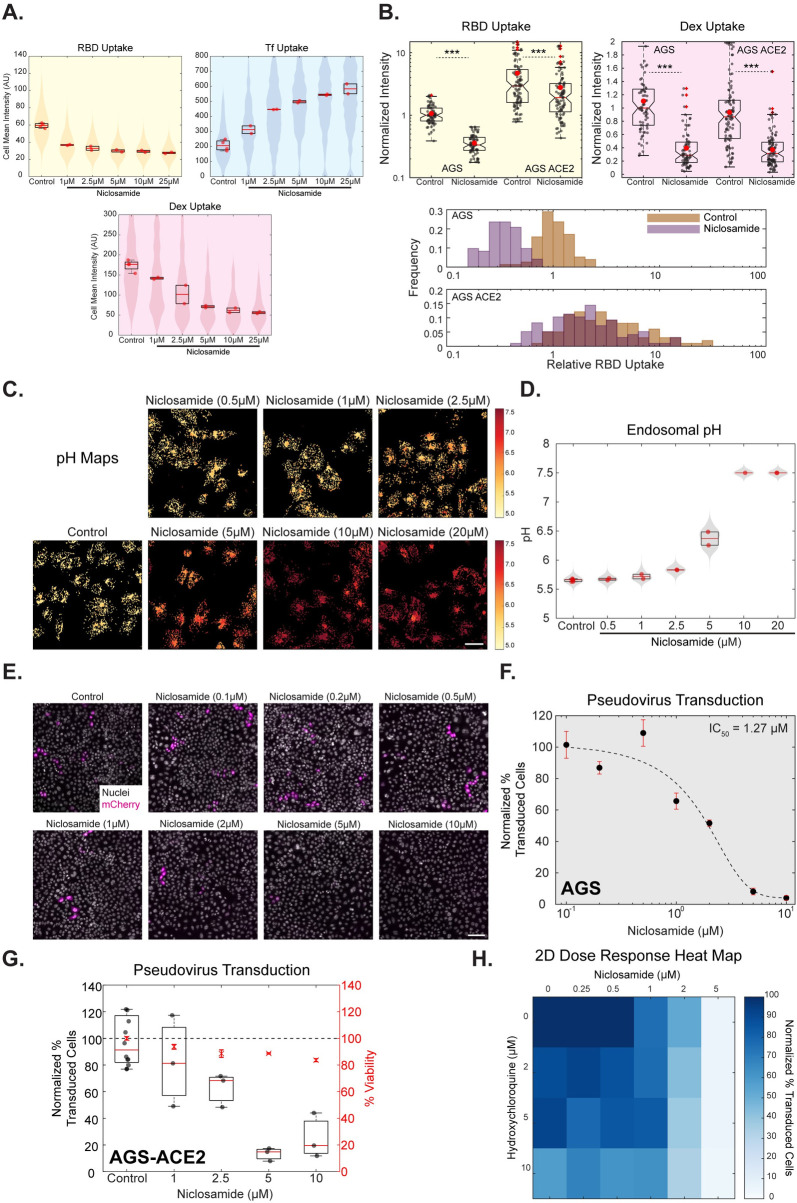
Fig 7. Niclosamide functions as an acidification and entry inhibitor.
A: High-throughput endocytic assay in which AGS cells were treated with different concentrations of Niclosamide for 30 minutes followed by pulse of RBD, dextran and transferrin for 30 minutes. RBD and dextran uptake reduces, and transferrin uptake increases in a dose-dependent manner. Images are shown in S8A, quantification in 7A and S8B and p-value table for all the concentrations is indicated in S1 Table. Number of repeats = 4 for Control (0.6% DMSO) and 2 each for each concentration of Niclosamide. Each repeat has >80 cells. B: AGS and AGS-ACE2 cells were treated with Control (0.2% DMSO) or 10μM Niclosamide for 30 minutes and pulsed with RBD and dextran for 30 minutes with or without the inhibitor. Treatment with Niclosamide reduces RBD (p-value < e-24 in AGS, < e-3 in AGS-ACE2) and dextran (p-value < e-17 in AGS, < e-16 in AGS-ACE2) uptake in both cell types. Numbers of cells > 70 for each treatment. C, D: High-throughput pH estimation assay in which AGS cells were pulsed with FITC and TMR dextran for 2 hours, chased for 1 hour with different concentrations of Niclosamide and imaged live. A dose-dependent increase in endosomal pH is seen with increasing Niclosamide concentrations. Images along with pH maps are shown in 7C and quantification in 7D and S8C. p-value table is indicated in S1 Table. Number of repeats = 6 for Control, 2 each for each concentration of Niclosamide and 1 for 10μM Niclosamide. Each repeat has >80 cells. E, F, G: Spike-pseudovirus transduction assay in which AGS cells (7E, 7F, S9A) or AGS-ACE2 (7G) were preincubated for an hour with different concentrations of Niclosamide or DMSO and incubated along with virus (MOI = 0.5) for 8 hours (7E, 7F) or 4 hours (S9A, 7G) followed by the continued presence of 100nM Niclosamide or 0.005% DMSO in the media after removal of the virus until termination. Images of cells expressing the reporter mCherry protein in E and Normalized percentage transduction in F (AGS) and G (AGS-ACE2) show a dose-dependent reduction in transduction efficiency upon treatment with Niclosamide compared to pooled control from different DMSO treatments. Black dots with red error bars represent mean +/- SD. Dotted line represents the sigmoidal fit of the means across different Niclosamide concentrations. Refer to S9A(i) for % viability quantification, S9A(ii) for transduction efficiency after 4 hours of incubation with the virus in AGS cells and S1 Table for p-value table. H: 2-dimensional dose-response heat map in H depicts the combinatorial Spike pseudovirus transduction assay in AGS cells with indicated concentrations of Niclosamide (0–5μM) and Hydroxychloroquine (0–10μM). Normalized percentage transduction of cells is represented as a heat map. Refer to S9F for % viability quantification. Data representation in A and D is as described in Fig 2, in B is as described in Fig 1. Scale bar: 40μm (C) and 100μm (E).

