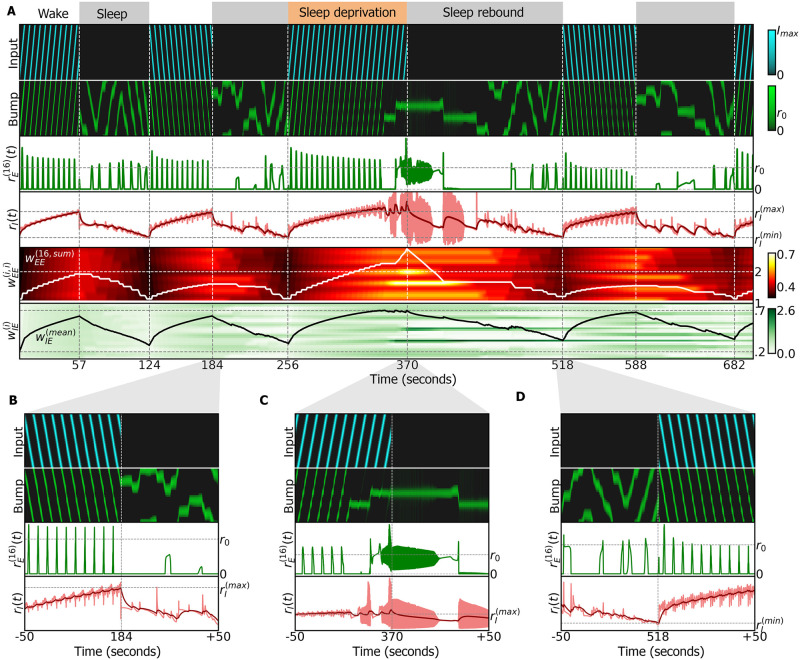
Fig 5. Simulation of ring attractor combined with sleep homeostasis model, using an anti-Hebbian plasticity rule during sleep.
A: Entire simulation over a period of 700 seconds. White and grey regions indicate the wake and sleep phases, and correspond to dFB neurons switching off and on, respectively. Top row: input (inhibited during the sleep phase), alternating between clockwise and counter-clockwise rotations at 0.5Hz. Second row: ring attractor bump activity. Third row: activity of wedge neuron 16. Fourth row, light red: activity of R5 neurons. Dark red: filtered activity. Switching between sleep and wake is carried out by dFB neurons that switch on and off depending on filtered activity crossing thresholds and . In the third wake epoch, sleep deprivation is produced by extending the inhibition of dFB neurons (d(t) = 1 during the orange top layout; see Methods). Fifth row: diagonal elements of the connectivity matrix . The white line is the sum of all excitatory connections to wedge neuron 16. It passes threshold 2 at around 240 seconds leading to oscillations. The full connectivity matrix at the switch times is shown in S6 Fig. Sixth row: connectivity ; black line is the mean value. B: Blow-up around 184 seconds: switch from wake to sleep phase. C: Blow-up around 370 seconds: extended wake phase leads to oscillatory behavior. Circuit switches to sleep. D: Blow-up around 518 seconds: switch from sleep to wake phase.

