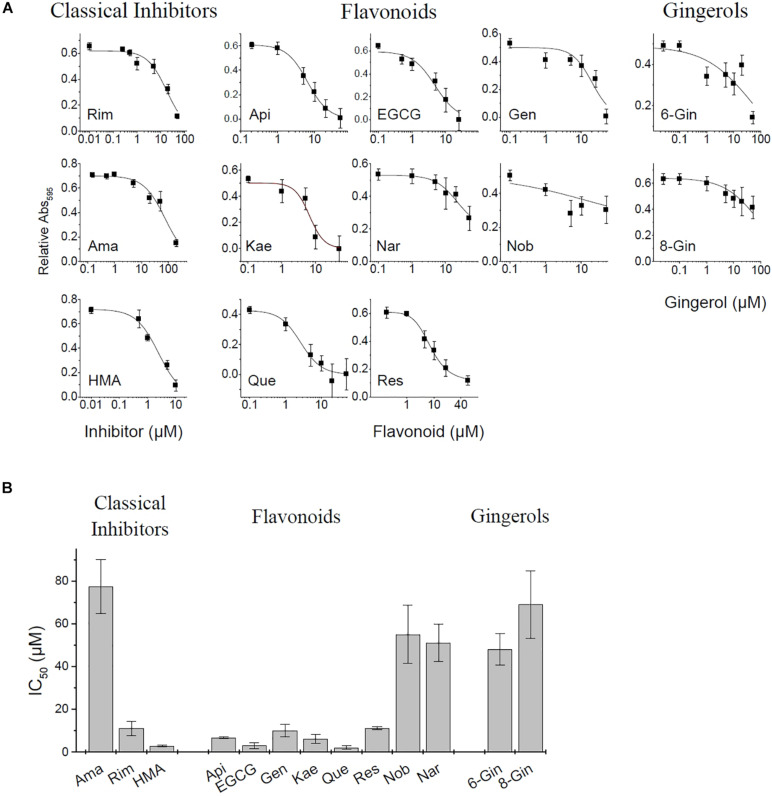
FIGURE 3.
MTT Cell viability assay for E protein activity. (A) Normalized absorbance at different inhibitor concentration. See Supplementary Figure 1 for more detail on pRK control and E protein data used for analysis. (B) Estimated IC50 values of investigated inhibitors (means ± SEM).

