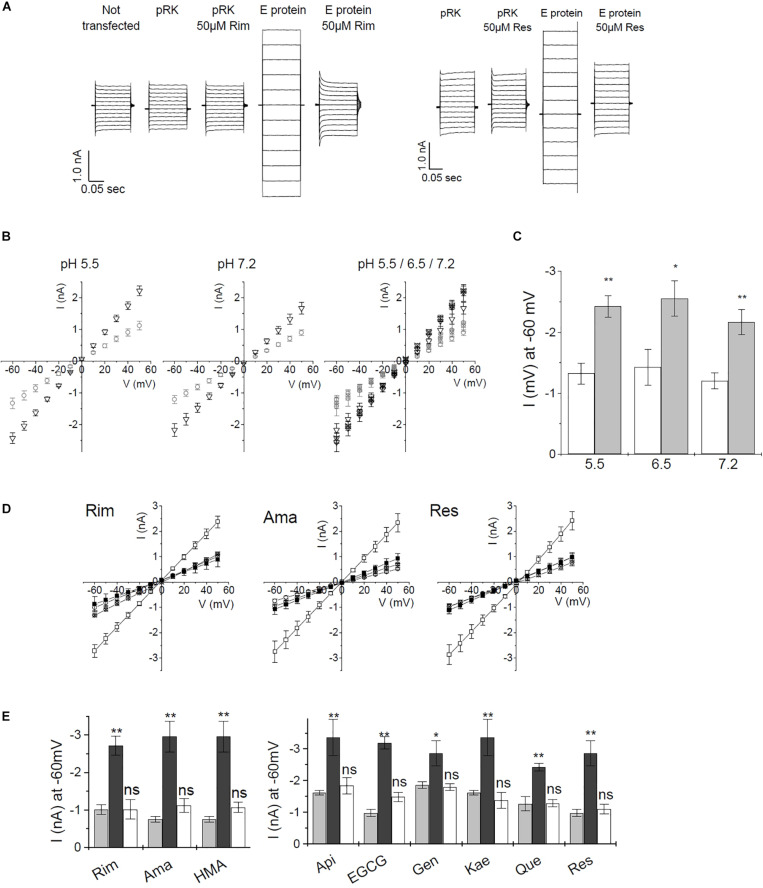
FIGURE 5.
Current–voltage recordings from recombinant SARS CoV E protein in HEK293 cells. (A) Direct currents from a voltage ramp from –60 to +50 mV. Controls were (i) untransfected cells, (ii) mock (empty pRK vector) transfected HEK293 cells. Left panel: inhibition by rimantadine, right panel: inhibition by resveratrol. (B) pH dependence of control cells and E protein expressing HEK293 cells using standard extracellular buffer. Left and middle panel: open circles: control cells; open triangles: E protein expressing cells. Right panel: open symbols: pH 7.2; symbols including +: pH 6.5; crossed symbols: pH 5.5. Left and middle panel: pH 5.5 and 7.2, respectively. Right panel: summary of currents at pH 5.5, 6.5, and 7.2. Induced currents over the investigated pH range were not significantly different. (C) pH dependence of E-protein-mediated currents at –60 mV. White bars: pRK control; gray bars: currents induced after E protein expression. (D) Inhibition of E-protein channels by rimantadine, amantadine, and resveratrol. Open symbols: no inhibitor, solid symbols: in presence of 20 μM of inhibitor; circles: control (empty pRK) cells; squares: E protein expressing cells. (E) Summary of inhibition data. Light gray columns: control currents (pRK); dark gray columns: E-protein expressing cells; white columns: E-protein currents in the presence of inhibitor (20 μM). Significance was determined using one-way ANOVA with *p < 0.05; **p < 0.01, n.s. = not significant. See Supplementary Figure 2 for a complete set of inhibition data.

