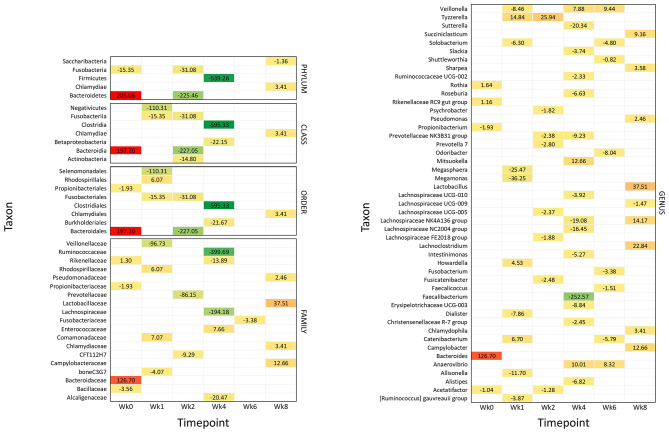
Figure 4.
Significantly different taxonomic groups in the fecal microbiota in the two calf groups at the different time points. The results are reported as a heatmap where red indicates a decrease and green indicates an increase of the normalized operational taxonomic unit (OTU) value in waste milk (WM) calves vs. bulk milk (BM) calves for each taxon at the different time points. The normalized OTU values and the statistical significance of the differences are reported in Supplementary Figures 2, 3, respectively.

