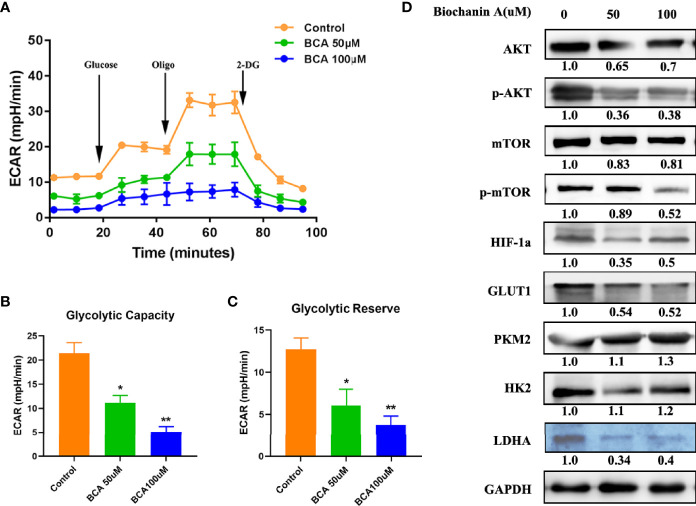
Figure 4.
BCA decreases the Glycolytic Capacity of U251 cells. (A) Glycolytic stress test to detect glycolytic activities in BCA (0, 50, 100 uM) group; (B) Quantification of the glycolytic capacity in A; (C) Quantification of the glycolytic reserve in A; (D) Western blot analysis of relative proteins of Glycolytic (AKT, p-AKT, mTOR, p-mTOR, HIF-1a, GLUT1, PKM2, HK2, and LDHA). *P < 0.05, **P < 0.01 versus control.

