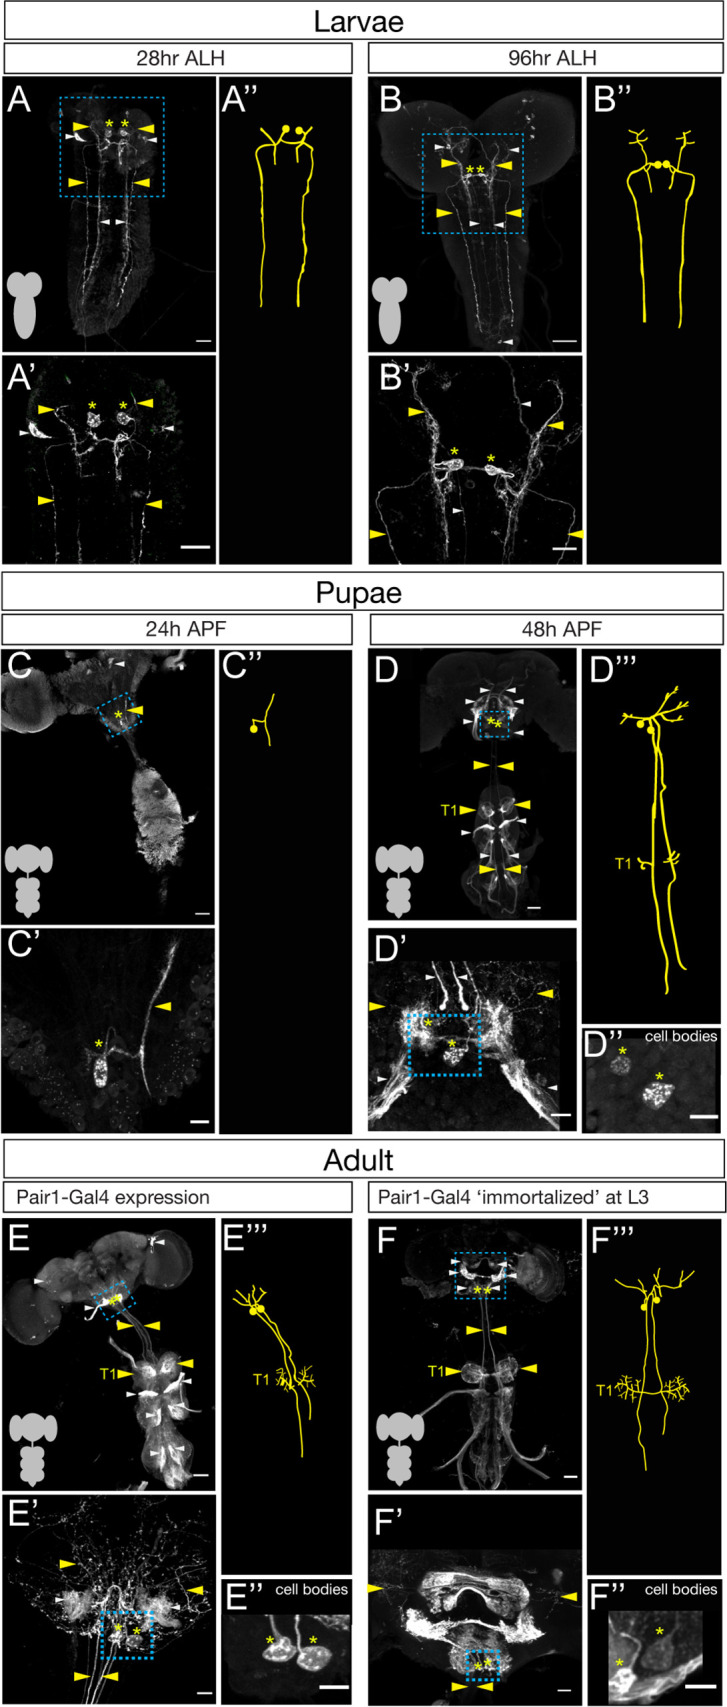
Figure 1. The Pair1 neuron persists from larval to adult stages.
(A–B) Pair1 neurons (cell body: yellow asterisk; neurites: yellow arrowhead) in the larval CNS (gray outline) at 28 hr after larval hatching (ALH) (A) and 96 hr ALH (B). Here and in subsequent panels are maximum intensity projections of confocal sections containing the Pair1 neurons; anterior, up; dorsal view. Significant ‘off-target’ expression marked with white arrowheads. Scale bar, 50 μm. (A’–B’) Enlargement of the brain regions boxed in A,B. Scale bar, 20 μm. (A”–B”) Tracing to show Pair1 neuron morphology. Genotype: +; UAS-myr::GFP; R75C02-Gal4. (C–D) Pair1 neurons (cell body: yellow asterisk; neurites: yellow arrowhead) in the pupal CNS (gray outline) at 24 hr after pupal formation (APF) (C) and 96 hr APF (D). Significant ‘off-target’ expression marked with white arrowheads. Scale bar, 50 μm. (C’–D’) Enlargement of the brain regions boxed in C, D; cell body: yellow asterisk, neurites: yellow arrowhead. Scale bar, 10 μm. (C”) Tracing to show Pair1 neuron morphology. (D”) Focal plane showing Pair1 cell bodies (region boxed in D’, cell body marked with yellow asterisks). Scale bar, 10 μm. (D”’) Tracing to show Pair1 neuron morphology. Note that Pair1 can be followed to T1 in the 3D confocal stack but is difficult to represent here due to fasciculation of Pair1 with off-target neurons. Genotype: +; UAS-myr::GFP; R75C02-Gal4. (E) Pair1 neurons (cell body: yellow asterisk; neurites: yellow arrowhead) in the 4-day adult CNS (gray outline) Significant ‘off-target’ expression marked with white arrowheads. Scale bar, 50 μm. (E’) Enlargement of the brain region boxed in E. Scale bar, 10 μm. (E”) Focal plane showing Pair1 cell bodies (region boxed in E’, cell body marked with yellow asterisks). Scale bar, 10 μm. (E”’) Tracing to show Pair1 neuron morphology. Genotype: +; UAS-myr::GFP; R75C02-Gal4. (F) Pair1 neurons (cell body: yellow asterisk; neurites: yellow arrowhead) permanently labeled at 96 hr ALH and visualized in the 4-day old adult. See Materials and methods for details. Significant ‘off-target’ expression marked with white arrowheads. Scale bar, 50 μm. (F’) Enlargement of the brain region boxed in F; Pair1 cell body: yellow asterisk; Pair1 neurites: yellow arrowhead. Scale bar, 10 μm. (F”) Focal plane showing Pair1 cell bodies (region boxed in F’, cell body marked with yellow asterisks). Scale bar, 10 μm. (F”’) Tracing to show Pair1 neuron morphology. Genotype: Hs-KD,3xUAS-FLP; 13xLexAop(KDRT.Stop)myr:smGdP-Flag/+; 13xLexAop(KDRT.Stop)myr:smGdP-V5, 13xLexAop(KDRT.Stop)myr:smGdP-HA, nSyb(FRT.Stop)LexA::p65.


