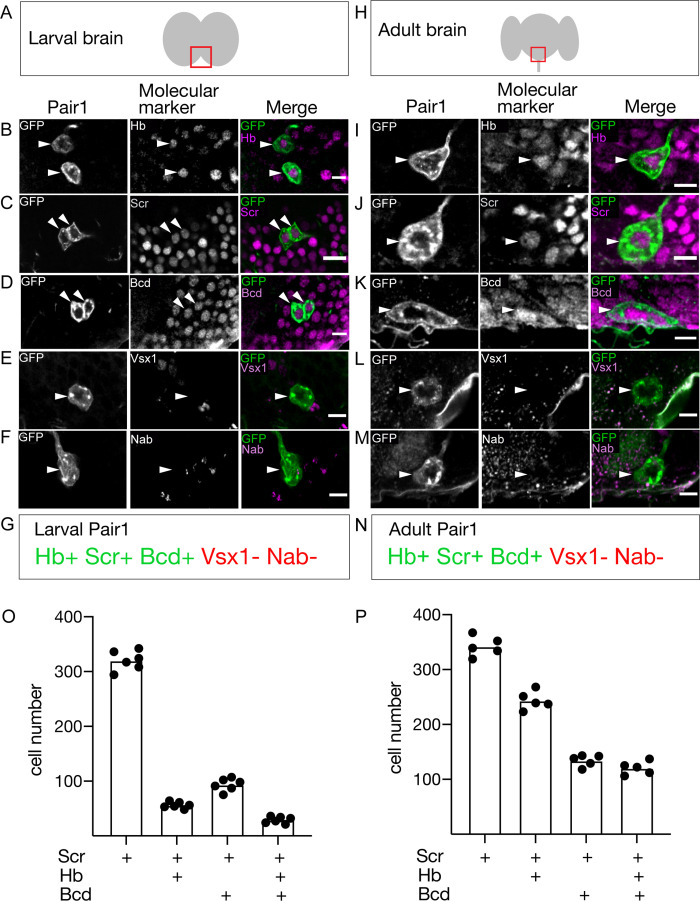
Figure 2. The Pair1 neuron expresses the same molecular markers at larval and adult stages.
(A) Schematic of the larval brain showing region of Pair1 neurons (red box) enlarged in panels below. Anterior up, dorsal view. (B–G) Larval Pair1 neurons (left column), indicated markers (middle column), and merge (right column) at 28 hr after larval hatching (ALH). In some cases the second Pair1 neuron is out of the focal plane, but both Pair1 neurons always have the same gene expression profile. Markers detect the following transcription factors: Hb, Hunchback; Scr, Sex combs reduced; Bcd, Bicoid; Vsx1, Visual system homeobox 1; and Nab. Scale bar, 5 μm. (G) Summary: marker expression matches that in adults. Genotype: +; UAS-myr::GFP; R75C02-Gal4. (H) Schematic of the adult brain showing region of Pair1 neurons (red box) enlarged in panels below. Anterior up, dorsal view. (I–N) Adult Pair1 neurons (left column), indicated markers (middle column), and merge (right column) in 4-day old adult. Scale bar, 5 μm. (N) Summary: marker expression matches that in larvae. Genotype: +; UAS-myr::GFP; R75C02-Gal4. (O–P) The number of cells expressing Scr (first column), Scr/Hb (second column), Scr/Bcd (third column), and Scr/Hb/Bcd (fourth column) in larvae (O) and adults (P). n = 5–6 whole brains.

