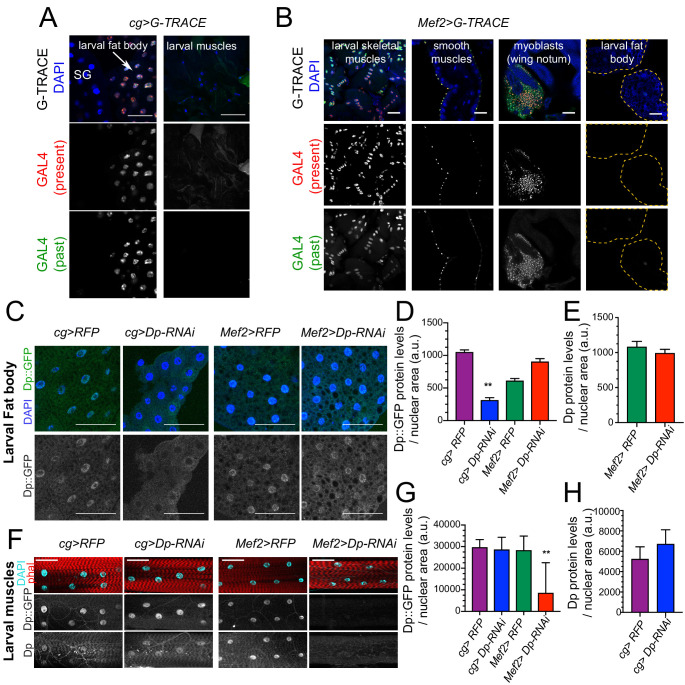
Figure 3. Dp expression is knock down in a tissue-specific manner.
(A–B) Lineage tracing of tissues dissected from third instar larvae stained with 4,6-diamidino-2-phenylindole (DAPI) and showing the lineage of cg-GAL4 (GFP) and the active GAL4 (RFP). (A) Confocal single plane images of cg>G-TRACE fat bodies, salivary glands, and muscles. Scale: 100 μm. (B) Confocal single plane images of Mef2>G-TRACE larval skeletal (body wall) and smooth (gut) muscles, adult myoblasts on the wing discs, and fat bodies. Scale: 50 μm. (C) Confocal single plane images of third instar larval fat bodies stained with DAPI and showing Dp::GFP tagged protein. White arrowheads indicate binucleated cells. Scale: 100 μm. (D) Quantification of Dp::GFP levels as shown in C, relative to nuclear area. Mean ± SEM, Kruskal-Wallis test followed by Dunn’s multiple comparisons test, **p<0.0001, n=11–20 per genotype. (E) Quantification of Dp protein levels relative to nuclear area in larval fat body of Mef2>RFP and Mef>Dp-RNAi animals. Mean ± SEM, Mann-Whitney test, p = 0.35, n=14 per genotype. (F) Confocal single plane images of third instar larval muscles immunostained with rabbit anti-Dp antibody (212), phalloidin, and DAPI. Scale: 50 μm. (G) Quantification of Dp::GFP levels as shown in F, relative to nuclear area. Mean ± SD, Kruskal-Wallis test followed by Dunn’s multiple comparisons test, **p = 0.0008, n=10–12 animals per genotype. (H) Quantification of Dp protein levels relative to nuclear area in larval fat body of cg>RFP and cg>Dp-RNAi animals. Mean ± SD, Mann-Whitney test, p = 0.07, n=6–9 per genotype. Full genotype: (A) cg-GAL4/UAS-gTRACE, (B) UAS-gTRACE,Mef2-GAL4, (C–H) cg-GAL4/UAS-mRFP,Dp[GFP], cg-GAL4/Dp[GFP],UAS-Dp [GD4444]-RNAi, UAS-mRFP,Dp[GFP];Mef2-GAL4, and Dp[GFP],UAS-Dp[GD4444]-RNAi,Mef2-GAL4.

