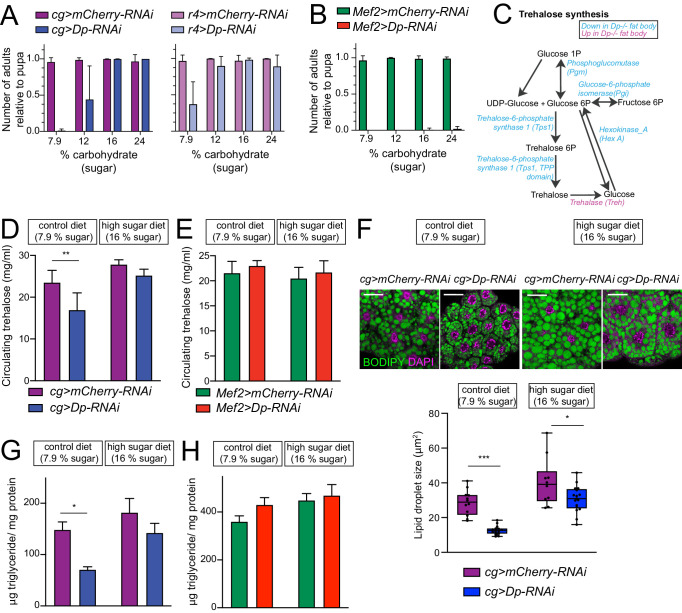
Figure 6. E2F/Dp in fat body exerts systemic effects modulated by sugar supplement.
(A–B) Number of viable adults (relative to pupa) fed on control diet (7.9% carbohydrate, 0.08% fat, and 1.9% protein) and increasing levels of sugar in food (12, 16% and 24% carbohydrate). Data are represented as mean ± SD, n = 6 repeats per condition. (A) Left panel: cg>mCherry RNAi and cg>DpRNAi, right panel: r4>mCherryRNAi and r4>DpRNAi. (B) Mef2>mCherry-RNAi and Mef2>Dp-RNAi. (C) Diagram of trehalose synthesis pathway. The enzymes that are significantly downregulated in Dp-deficient fat body are indicated in blue, and upregulated in magenta, based on proteome data. (D–E) Circulating trehalose levels measured in third instar larval hemolymph. (D) cg>mCherry-RNAi and cg>Dp-RNAi, and (E) Mef2>mCherry-RNAi and Mef2>Dp-RNAi larvae fed on control diet (7.9% carbohydrate) and high sugar diet (16% carbohydrate). Data are represented as mean ± SD, two-way ANOVA followed by Tukey’s multiple comparisons test, three independent experiments were done, one representative experiment is shown. (D) n = 6 per group and **p = 0.0005. (E) n = 3–6 per group and p = 0.5. (F) Top panel: Confocal single plane images of third instar larval fat bodies stained with 4,6-diamidino-2-phenylindole (DAPI) and BODIPY red. The cg>mCherry-RNAi and cg>Dp-RNAi animals were fed on control diet (7.9% carbohydrate) and supplemented with sugar (16% carbohydrate, high sugar diet). Scale: 40 μm. Bottom panel: Measurement of lipid droplet size in fat body. Data are represented as box and whiskers, min to max showing all points, n = 10–17 fat bodies per genotype, two-way ANOVA followed by Tukey’s multiple comparisons test, *p = 0.02, ***p < 0.0001, three independent experiments, one representative experiment is shown. (G–H) Triglycerides content measured in third instar larva and normalized to total protein content. (G) cg>mCherry-RNAi and cg>DpRNAi, and (H) Mef2>mCherry RNAi and Mef2>DpRNAi larvae fed on control diet (7.9% carbohydrate) and high sugar diet (16% carbohydrate). Data are represented as mean ± SEM, two-way ANOVA followed by Tukey’s multiple comparisons test, one representative experiment is shown, (G) n = 5–6 per group and *p = 0.004. Three independent experiments were done. (H) n = 5–6 per group and p = 0.2, two independent experiments were done. Full genotypes are (A) cg-GAL4,UAS-mCherry-RNAi, cg-GAL4/UAS-Dp[GD4444]-RNAi, r4-GAL4/UAS-mCherry-RNAi, UAS-Dp[GD4444]-RNAi/r4-GAL4 (B, E, H) Mef2-GAL4/UAS-mCherry-RNAi, and UAS-Dp[GD4444]-RNAi,Mef2-GAL4 (D, F, G) cg-GAL4,UAS-mCherry-RNAi and cg-GAL4/UAS-Dp[GD4444]-RNAi.


