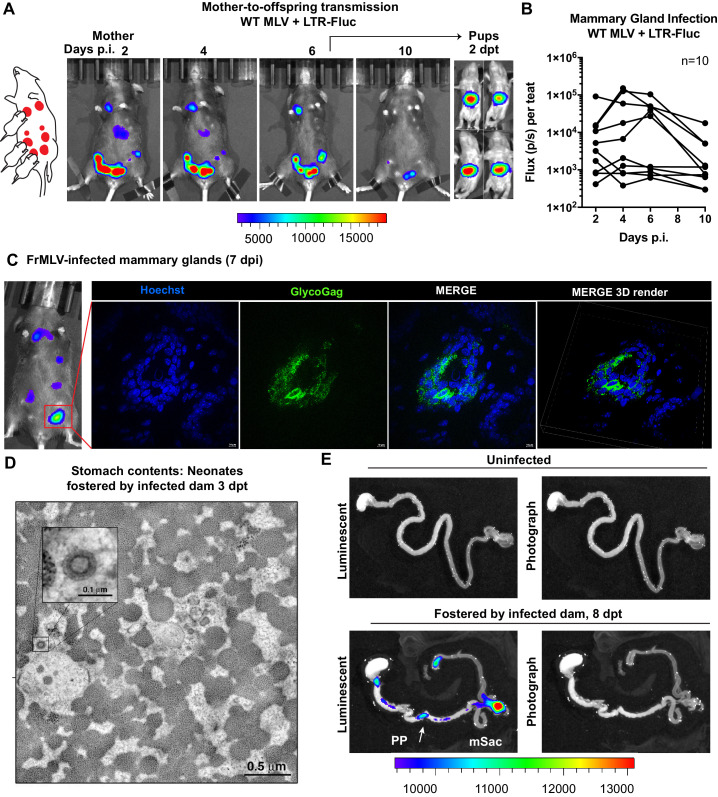
Figure 5. Visualization of murine leukemia virus (MLV) transmission from mother to offspring.
(A) A scheme showing MLV-infected dam fostering pups. 1 × 10⁷ IU of WT FrMLV carrying MLV LTR-Fluc were inoculated by distribution in mammary glands of a lactating dam. Virus replication in the dam was monitored longitudinally via NBLI. At 6 days post infection (dpi), neonatal mice from a separate litter were provided to foster and successful MLV transmission from dam to pups was visualized 2 days post-transfer (dpt) by NBLI. (B) Fluc activity indicating virus replication in infected teats was measured longitudinally and plotted as photon flux (p/s); flux from individual teats is shown. (C) Immunostained images of cryosections obtained from indicated mammary gland of a lactating dam infected as in (A) (7 dpi). MLV-infected epithelial cells (green) in the teats were identified using antibodies to MLV GlycoGag and nuclei were stained using Hoechst 3342 (blue). 3-D volume-rendered images were generated from z-planes images taken 0.3 µm apart. (D) Electron tomography of stomach contents at 3 dpt from an infected neonate for an experiment as in (A), revealing free viruses in the stomach. Inset: Details of a single cell-free MLV particle within the sample volume. Scale bars as indicated. (E) Merged luminescence and photographs gastrointestinal (GI) tract from an uninfected neonatal mouse or from a neonatal mouse that was allowed to feed for 8 days (8 dpt) from infected dam for an experiment as in (A) showing luminescent signal in Peyer’s patches (PP) and mesenteric LN (mLN). Scale bars shown for bioluminescence imaging denote radiance in photons per second per square centimeter per steradian (p/s/cm2/sr).


