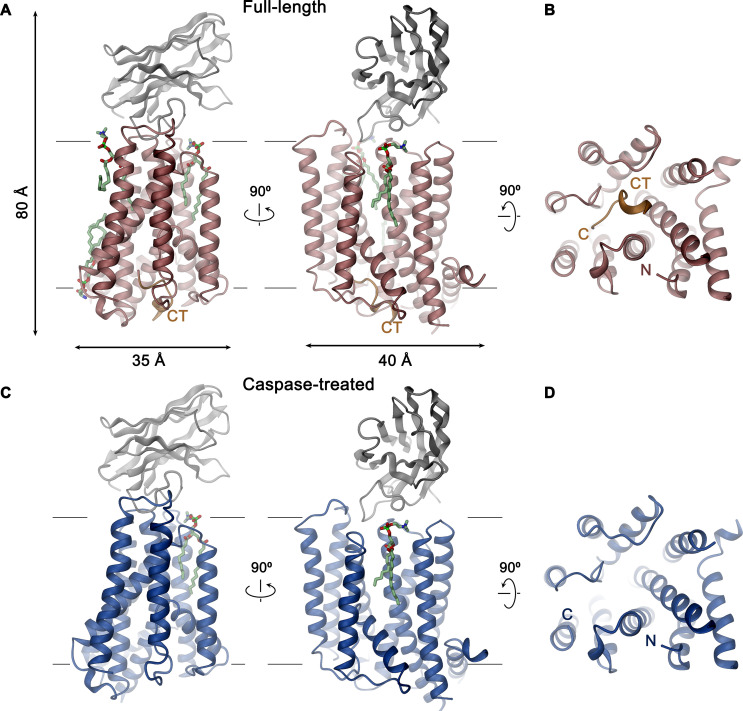
Figure 3. XKR9-SB1XKR9 complex.
Ribbon representation of Sb1XKR9 complexes of (A, B) full-length and (C, D) caspase-treated rXKR9. The relationship between orientations is indicated. rXKR9 is shown in unique colors, Sb1XKR9 in gray, and the C-terminus of the full-length protein (CT) that is cleaved upon caspase-3-treatment in orange. Bound lipids are shown in green as stick models. (A, C) View is from within the membrane, with membrane boundaries indicated. (B, D) View is from the cytoplasm.


