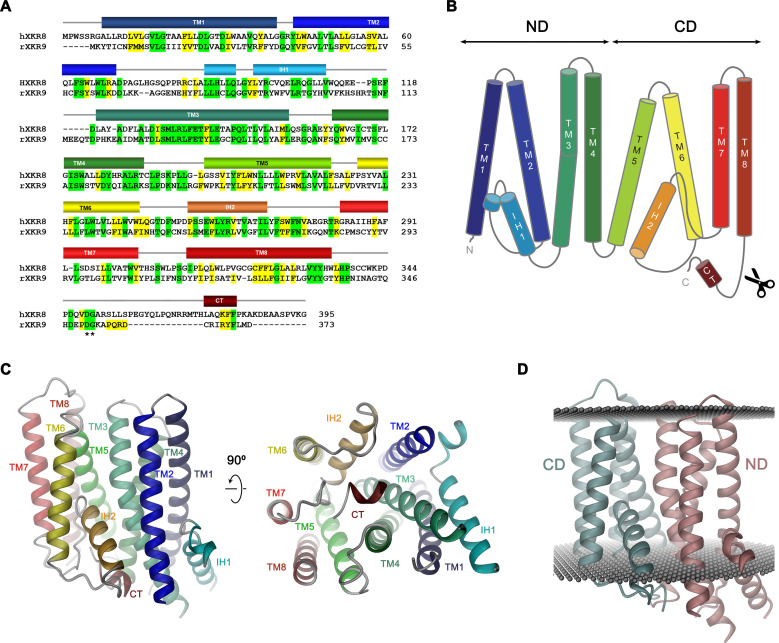
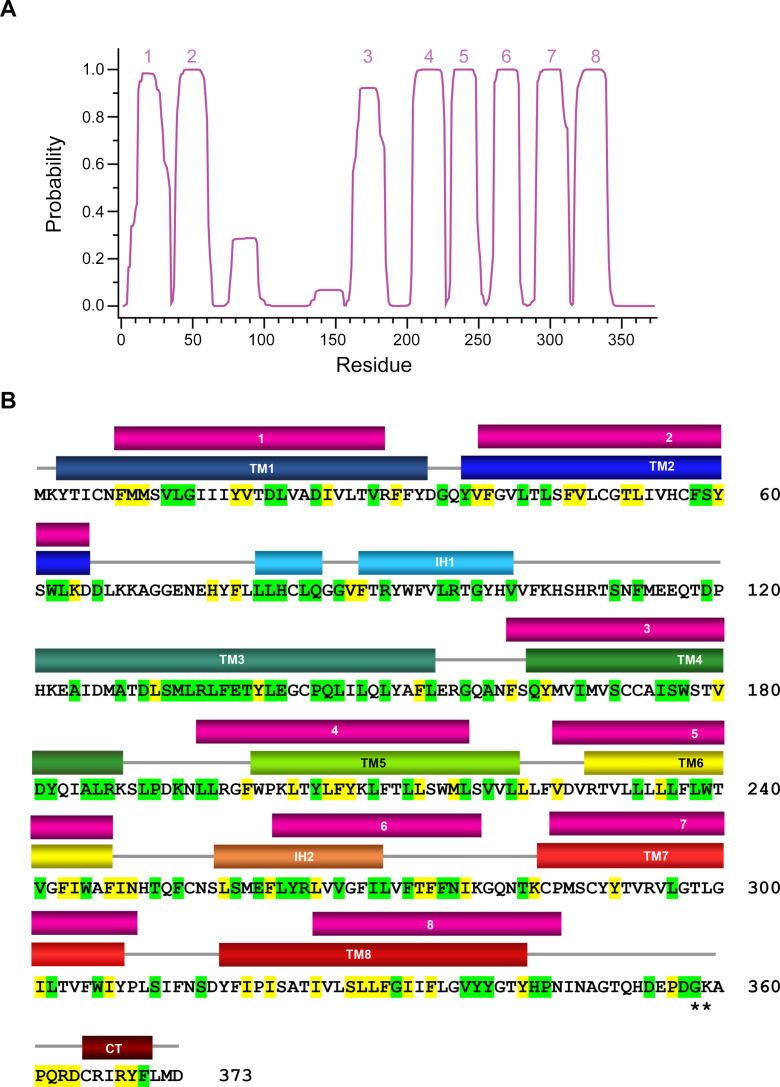
Figure 4. Sequence and topology.
Sequence alignment of human XKR8 (hXKR8, NCBI: NP_060523.2) and rXKR9 (NCBI: NP_001012229.1), secondary structure elements are indicated. Identical residues are highlighted in green, similar residues in yellow. The caspase-3 cleavage site is marked by *. (B) Schematic topology of rXKR9. ND and CD refer to N-terminal and C-terminal domain, respectively. Scissors indicate location of caspase cleavage site. (C) Ribbon representation of the rXKR9 subunit. The relationship between orientations is indicated. Color code is as in (A) and (B). (D) Ribbon representation of rXKR9 with ND and CD shown in unique colors. Gray spheres indicate inner and outer boundaries of the hydrophobic core of the lipid bilayer.


