. 2021 Jul 13;10:e68719. doi: 10.7554/eLife.68719

Figure 1. Cryo-EM structure of the GIP1-42–GIPR–Gs complex.

(A) Cut-through view of the cryo-EM density map that illustrates the GIP1-42–GIPR–Gs complex and the disc-shaped micelle. The unsharpened cryo-EM density map at the 0.07 threshold shown as light gray surface indicates a micelle diameter of 11 nm. The colored cryo-EM density map is shown at the 0.16 threshold. (B) Model of the complex as a cartoon, with GIP1-42 as helix in orange. The receptor is shown in light sky blue, Gαs in yellow, Gβ subunit in cyan, Gγ subunit in navy blue, and Nb35 in gray.

Figure 1—source data 1. Effects of GIP1-42-mediated cAMP accumulation and binding affinity.

Figure 1.

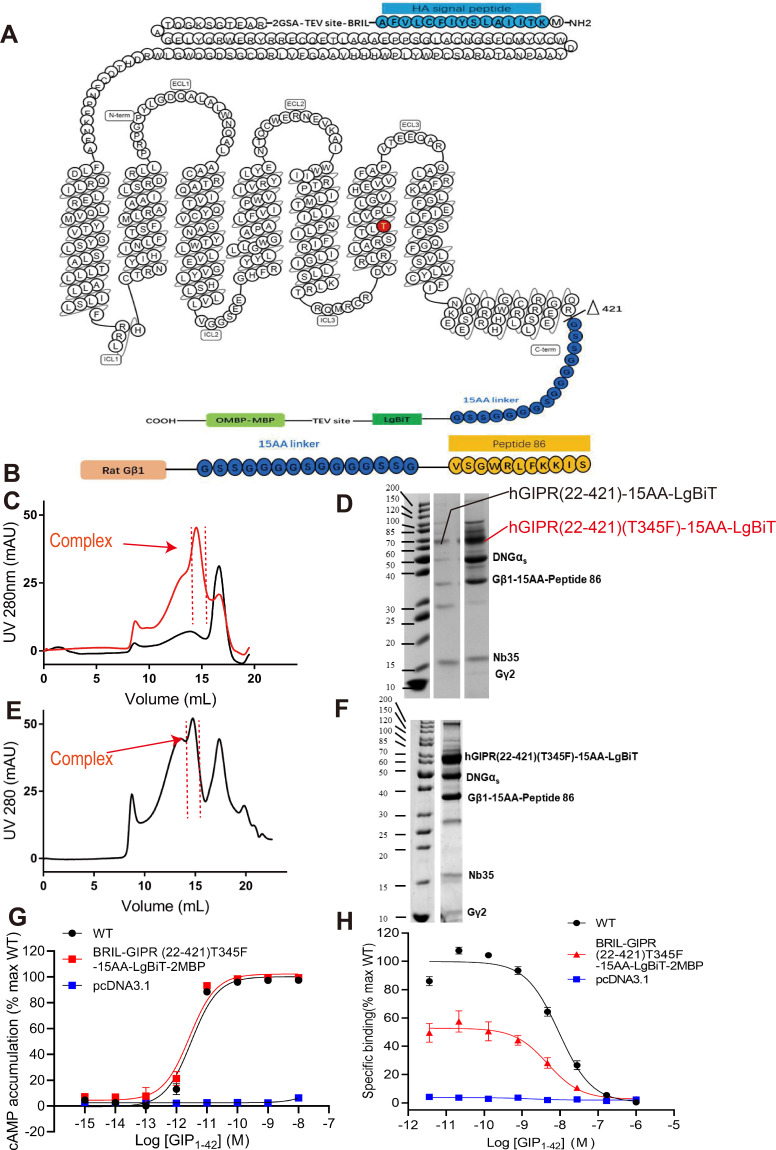
Figure 1—figure supplement 1. Purification and characterization of the GIP1-42–GIPR–Gs–Nb35 complex.

Figure 1—figure supplement 1.

(A) Human GIPR constructs used for structure determination. The signal peptide of the GIPR was replaced by the HA signal peptide (blue). A BRIL fusion protein was added at the N terminus of the receptor, followed by a TEV protease site between them. GIPR was truncated at R421, followed by a 15 amino acid linker (15AA, dark blue) and LgBiT (green). The C terminus was modified with a TEV protease site and an OMBP-MBP (light green) tag. The mutation site at T345 was highlighted in red. (B) Gβ1 constructs used for structure determination. Rat Gβ1 (orange) was attached to peptide 86 (orange) with a 15AA linker (dark blue) between them. (C) Size-exclusion chromatography results of the GIP1-42–GIPR(22-421)Gs–Nb35 (black line) and GIP1-42–GIPR(22-421)(T345F)–Gs–Nb35 (red line) complexes on Superose 6 Increase 10/300GL. (D) SDS-PAGE of the GIP1-42–GIPR(22-421)Gs–Nb35 and GIP1-42–GIPR(22-421)(T345F)Gs–Nb35 complexes. (E) Size-exclusion chromatography results on Superose 6 Increase 10/300GL. (F) SDS–PAGE of the GIP1-42–GIPR–Gs–Nb35 complex. (G) cAMP responses following GIP1-42 stimulation in HEK 293T cells transfected with wild-type (WT, HA-Flag-3GSA-GIPR(22-466)) or truncated GIPR constructs (HA-Flag-3GSA-BRIL-TEV-2GSA-GIPR(22-421)T345F-15AA-LgBiT-TEV-2MBP). Signals were normalized to the maximum response of WT and dose–response curves were analyzed using a three-parameter logistic equation. (H) Binding of GIP1-42 to the full length (residues 22-466) or truncated (residues 22-421) GIPR in CHO-K1 cells in competition with [125I]-GIP1-42.
Figure 1—figure supplement 2. Cryo-EM analysis of the GIP1-42–GIPR–Gs complex.

Figure 1—figure supplement 2.

(A) Representative cryo-EM micrograph (scale bar: 50 nm) and two-dimensional class averages (scale bar: 5 nm). (B) Flow chart of cryo-EM data processing. Details are described in Materials and methods. (C) Local resolution distribution map of the GIP1-42–GIPR–Gs complex. (D) Gold-standard Fourier shell correlation (FSC) curves of overall refined receptor.
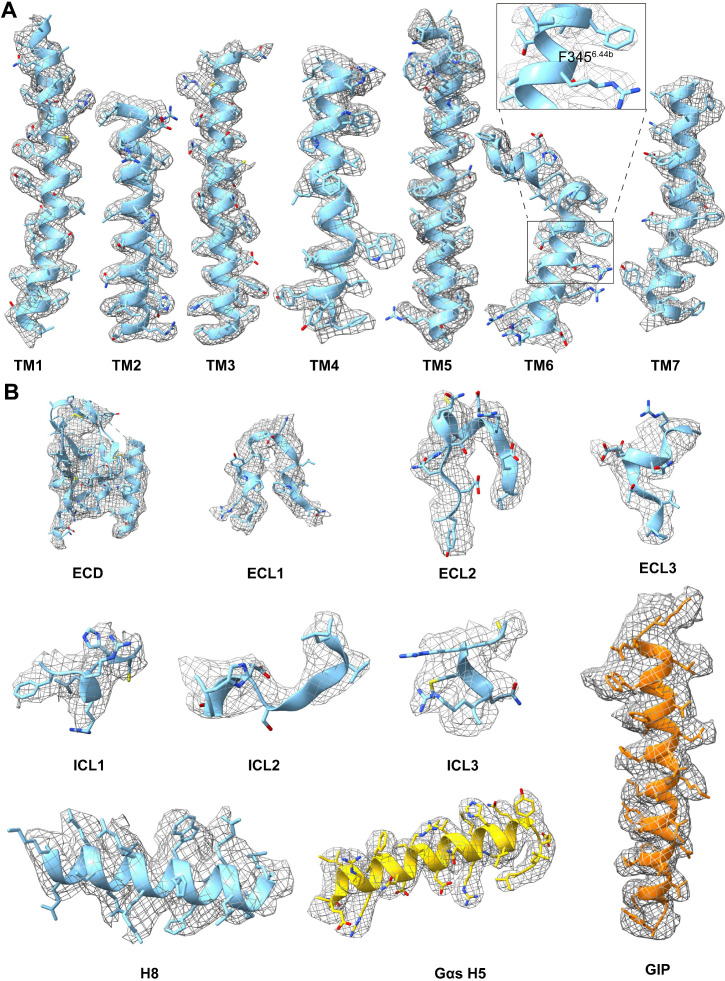
Figure 1—figure supplement 3. Atomic resolution model of the GIP1-42–GIPR–Gs complex in the cryo-EM density map.

Figure 1—figure supplement 3.

EM density map and model are shown for all seven transmembrane α-helices (A), ECD, helix eight, and all extracellular loops of GIPR, the α5-helix of the Gαs Ras-like domain and GIP1-42 (B). Insert in (A) is the close-up of the density of F3456.44b.