. 2021 Jul 13;10:e68719. doi: 10.7554/eLife.68719

Figure 2. Molecular recognition of GIP by GIPR.

(A) The binding mode of GIP (orange) with GIPR (light sky blue), showing that the N-terminal half of GIP penetrates into a pocket formed by all TM helices except TM4, ECL2, and ECL3, whereas the C-terminal half is recognized by ECD, ECL1, and TM1. (B, C) Close-up views of the interactions between GIP and GIPR. The residues and side chains that could not be modelled in the ECD are colored in red. (D) Signaling profiles of GIPR mutants. cAMP accumulation in wild-type (WT) and single-point mutated GIPR expressing in HEK 293T cells. Signals were normalized to the maximum response of the WT and dose–response curves were analyzed using a three-parameter logistic equation. All data were generated and graphed as means ± S.E.M. of at least three independent experiments, conducted in quadruplicate. Δ, truncated residues.

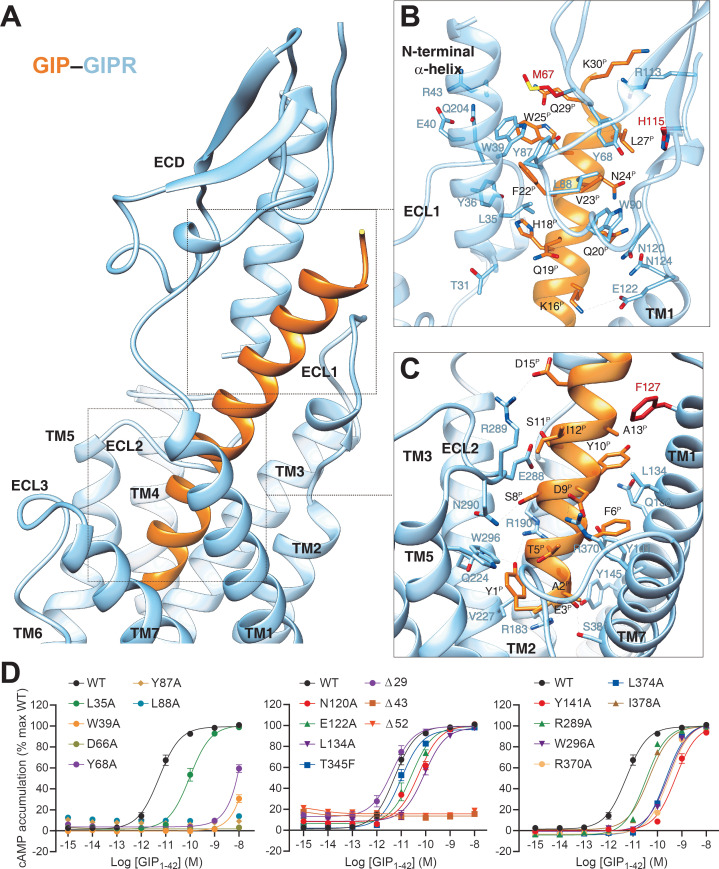
Figure 2—source data 1. Effects of residue mutation in the ligand-binding pocket on GIP1-42-induced cAMP accumulation, cell surface expression, and binding affinity.

Figure 2.

Figure 2—figure supplement 1. Effects of residue mutation in the ligand-binding pocket on GIP1-42-induced β-arrestin2 recruitment.

Figure 2—figure supplement 1.

GIP1-42 induced β-arrestin2 recruitment. HEK 293 T cells were transiently co-transfected with GIPR-Rluc8 and Venus-β-arrestin2 (β-arr2). Data presented are AUC of BRET signals measured for 10 min post-stimulation. For quantification of concentration-responses, data were corrected for the vehicle control and then normalized to the maximal response of wild-type (WT) GIPR. Data were fitted to non-linear regression three-parameter logistic curves. Δ, truncated residues.
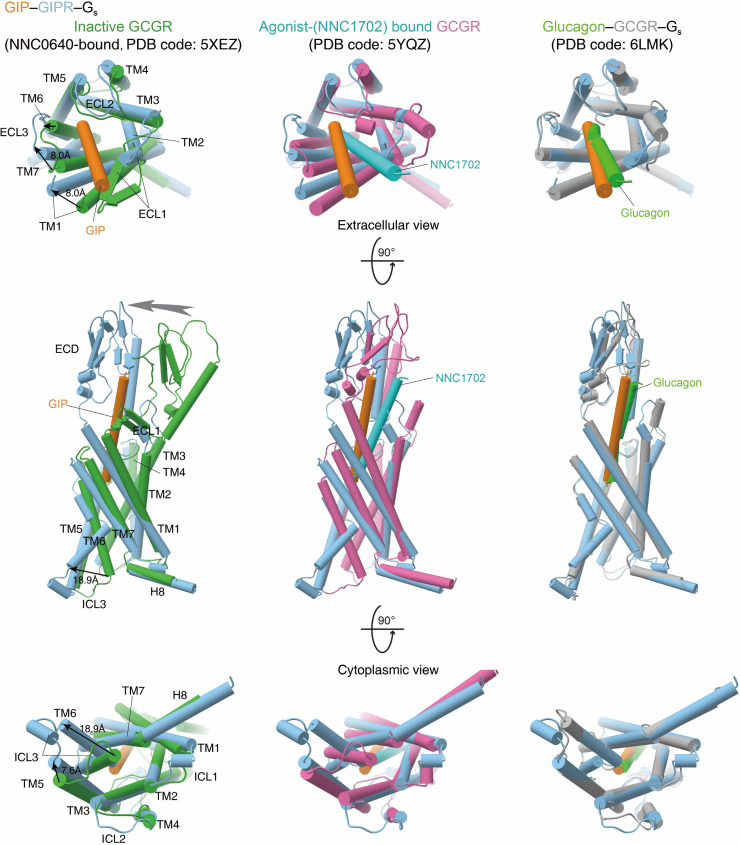
Figure 2—figure supplement 2. Conformational changes upon GIPR activation.

Figure 2—figure supplement 2.

Comparison of active GIPR with inactive, agonist-bound, and both agonist-bound and G protein-coupled active GCGR (Zhang et al., 2020). G proteins are omitted for clarity.