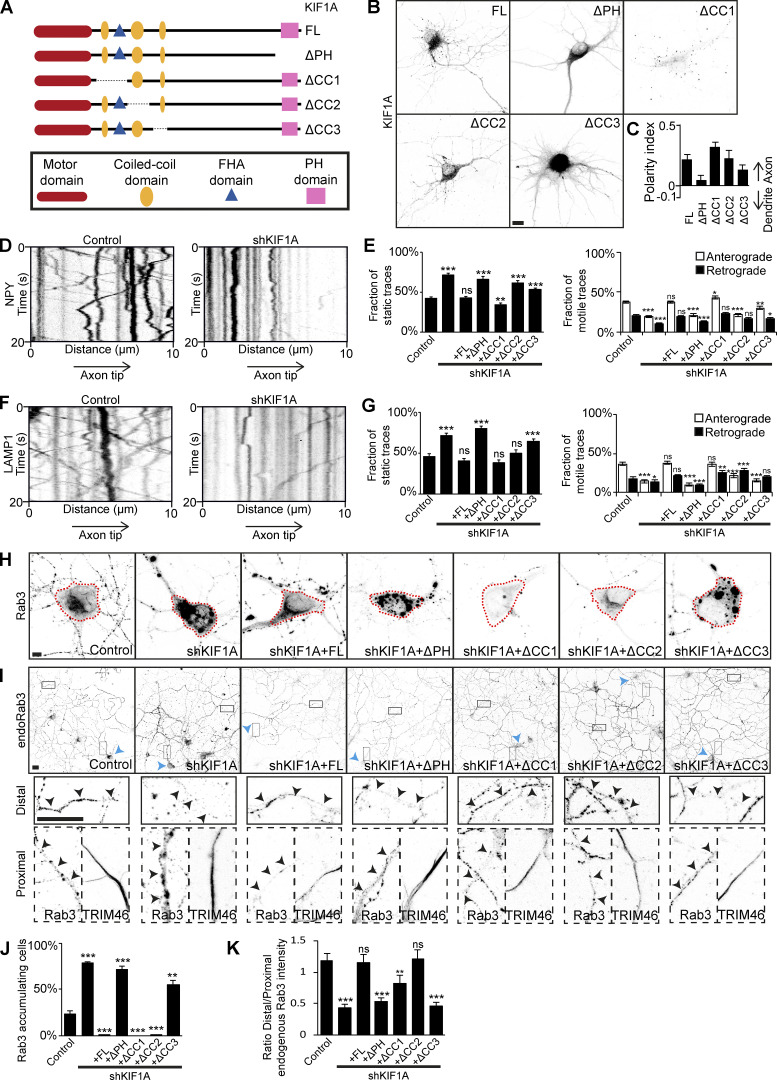
Figure 3.
Validation of the KIF1A CC3 and PH domains as minimal domains for cargo interaction. KIF1A KD and rescue experiments to verify the requirement of KIF1A CC3 and PH domains in cargo association. (A) Schematic depiction of the structure of KIF1A deletion constructs. (B) Representative images of hippocampal neurons expressing KIF1A deletion constructs. (C) Quantification of the polarity index of KIF1A deletion constructs (N = 3, n = 39–45). (D and F) Representative kymographs showing movement of NPY (D) or LAMP1 (F) vesicles in the AIS in control or when transfected with KIF1A shRNA. (E and G) Quantification of the fraction of static, anterograde, and retrograde NPY (E) or LAMP1 (G) traces in control, KIF1A KD, and rescue with KIF1A deletion constructs (N = 3, n = 40–45; except NPY in KD + ΔPH, N = 2, n = 25). (H) Representative images of the soma of hippocampal neurons expressing GFP-Rab3 in control, cotransfected with KIF1A shRNA, or with KIF1A shRNA and KIF1A deletion constructs. Dotted red line marks the cell soma. (I) Representative images of hippocampal neurons immunostained for Rab3 in control situation, when transfected with KIF1A shRNA, or with KIF1A shRNA and KIF1A deletion constructs. Blue arrowheads indicate the soma of a transfected cell, closed boxes mark part of the distal axon, and dotted boxes mark the proximal axon. Zooms of the boxes are shown underneath, including TRIM46 staining in the proximal axon. Black arrowheads indicate the axon of the transfected neuron. (J) Quantification of the number of cells with Rab3 accumulation in the cell soma in control, KIF1A KD, and rescue with KIF1A deletion constructs (N = 4, n = 370–400). (K) Quantification of the ratio of endogenous Rab3 intensity in the distal axon to that of the proximal axon in control, KIF1A KD, and rescue with KIF1A deletion constructs (N = 3, n = 38–40). Data are displayed as mean ± SEM. Unpaired t test (E) and Mann–Whitney U test (G, J, and K); *, P < 0.05; **, P < 0.01; ***, P < 0.001. Scale bars, 10 µm (B), 5 µm (H), and 20 µm (I).

