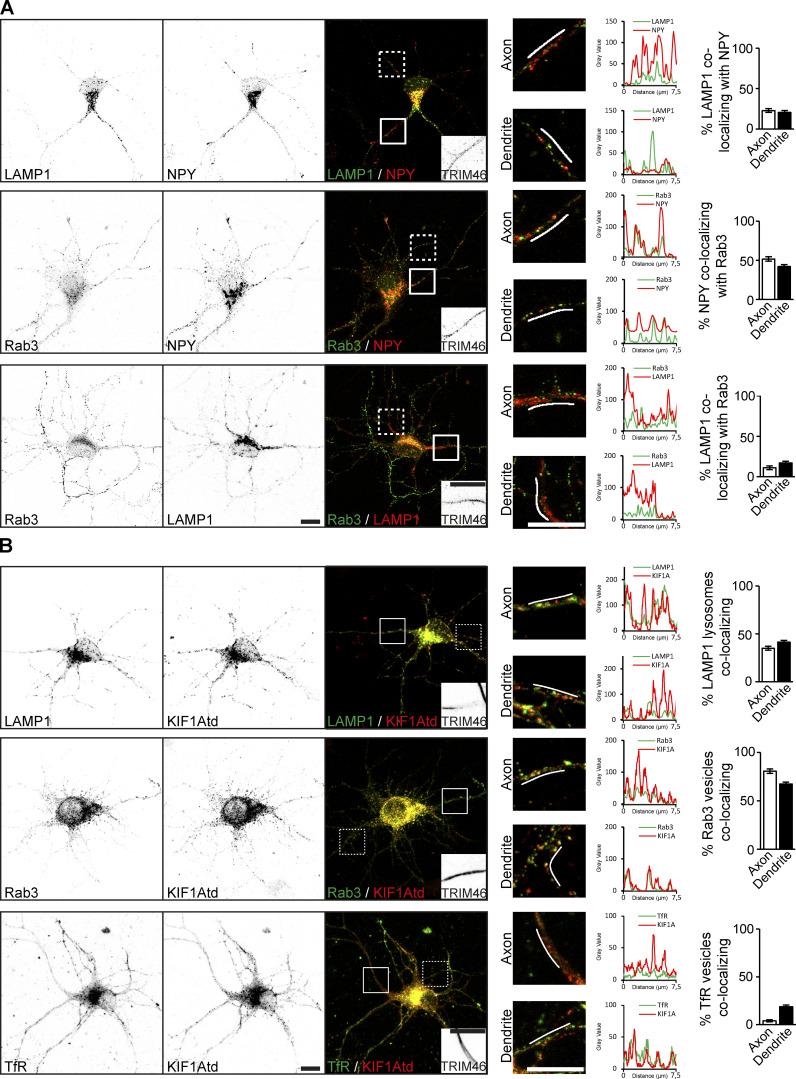
Figure S2.
Colocalization of cargo vesicles and KIF1A. Related to Fig. 1. Representative images and quantifications showing colocalization of vesicle markers and KIF1A colocalization with vesicles. (A) Representative images of hippocampal neurons coexpressing different combinations of vesicle markers. White boxes on the merged image mark the axon (continuous line) and a dendrite (dotted line). TRIM46 staining in the axon is shown in the merged image. Merged zooms of the boxes are depicted on the right. Graphs show the intensity of cargo along the line marked in the zooms. Quantifications of the percentage of vesicle markers colocalizing with each other in the axon and dendrites are shown on the right (N = 3, n = 29–33 axons and 87–99 dendrites). (B) Representative images of hippocampal neurons coexpressing KIF1Atd and GFP-tagged LAMP1, Rab3, or TfR. White boxes on the merged image mark the axon (continuous line) and a dendrite (dotted line). TRIM46 staining in the axon is shown in the merged image. Merged zooms of the boxes are depicted on the right. Graphs show the cargo (green) and KIF1A (red) intensity along the line marked in the zooms. Quantifications of the percentage of vesicle markers colocalizing with KIF1A in the axon and dendrites are shown on the right (N = 3, n = 27–36 axons and 54–72 dendrites). Scale bars, 10 µm.

