Figure S5.
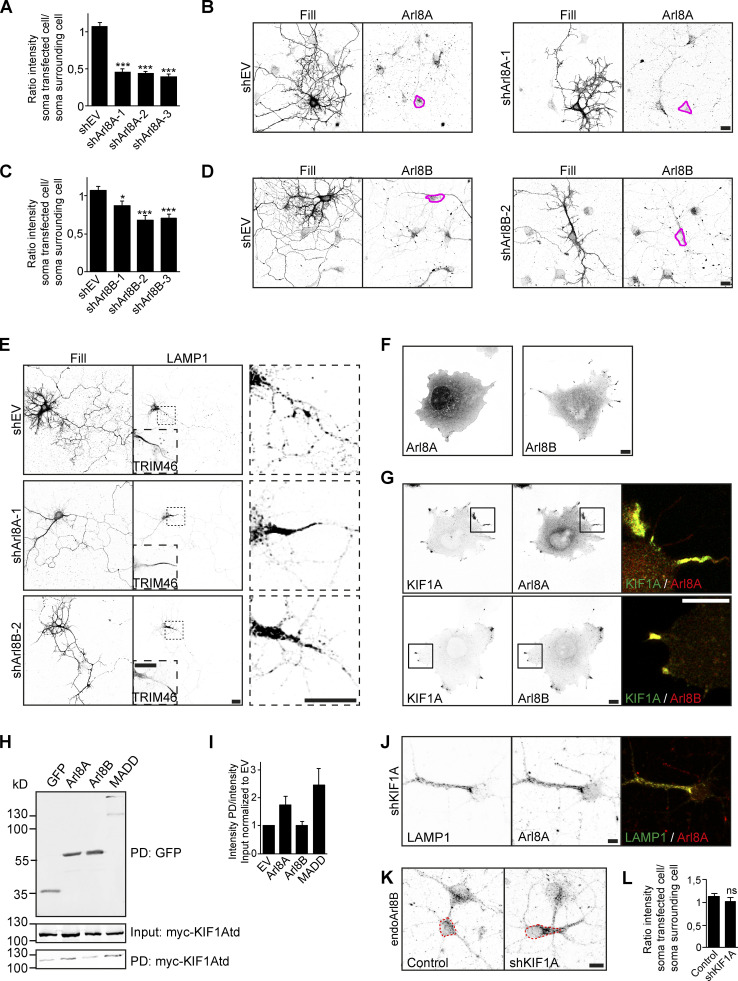
Identification of Arl8A and MADD as specific KIF1A adaptors. Related to Fig. 5. Validation of Arl8 shRNAs and investigation of Arl8A and MADD as specific KIF1A adaptors. (A and C) Quantification of the ratio of endogenous Arl8A (A) or Arl8B (C) intensity in a transfected cell to that of a surrounding cell in control and with different shRNAs against Arl8A (A) or Arl8B (C; N = 4, n = 40–35). (B and D) Representative images of hippocampal neurons expressing shEV, shArl8A-1 (B), or shArl8B-2 (D), immunostained for Arl8A (B) or Arl8B (D). Pink lines mark the cell soma of the transfected cell. (E) Representative images of hippocampal neurons coexpressing LAMP1 together with shEV, shArl8A-1, or shArl8B-2. TRIM46 staining in the dotted box is shown in the bottom left to mark the axon. Zooms of the dotted boxes are shown on the right. (F) Representative images of COS7 cells expressing Arl8A or Arl8B. (G) Representative images of COS7 cells coexpressing KIF1A together with Arl8A or Arl8B. Merged image of the boxed region is shown on the right. (H) Pull-down experiment showing the interaction between KIF1A_395–1105 and bioGFP-adaptors in HEK293T cell lysates. (I) Quantification of the ratio of KIF1A_395–1105 intensity in the pull-down fraction to that of the input fraction normalized to bioGFP-EV (N = 3). (J) Representative image of a hippocampal neuron coexpressing shKIF1A and LAMP1-GFP and immunostained for Arl8A. (K) Representative images of the soma of hippocampal neurons immunostained for Arl8B in control or when transfected with KIF1A shRNA. Dotted red lines mark the cell soma. (L) Quantification of the ratio of endogenous Arl8B intensity in a transfected cell to that of a surrounding cell in control or KIF1A KD (N = 3, n = 29–30). Data are displayed as means ± SEM. Unpaired t test (A) and Mann–Whitney U test (C and L), *, P < 0.05; ***, P < 0.001. Scale bars, 20 µm (B, D, and E) and 10 µm (F, G, J, and K).

