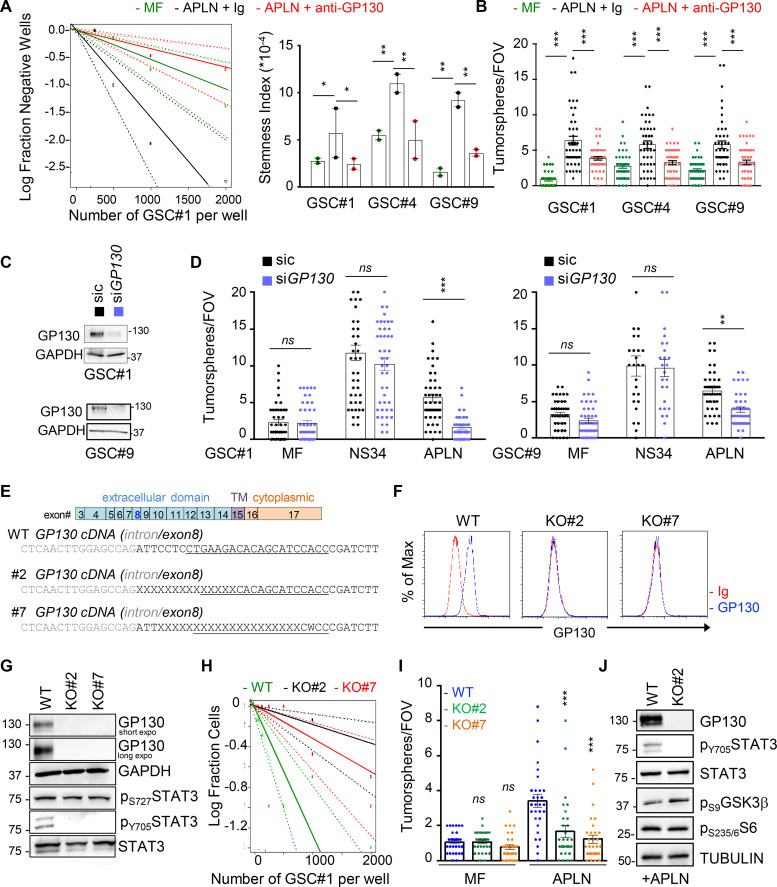
Figure 2.
GP130 is required for APLN-mediated GSC expansion. (A) Patient-derived GSCs (mesenchymal GSC#1, mesenchymal GSC#4, and classical GSC#9) were cultured in MF conditions (green), MF medium containing APLN (1 µM) plus control isotype Ig (2 µg/µl, black), and MF containing APLN (1 µM) plus anti-GP130 antibody (2 µg/µl, red). Linear regression plot of in vitro LDA is shown for GSC#1. Data are representative of two independent experiments. Stemness frequency was calculated from LDA in GSC#1, GSC#4, and GSC#9. Data are presented as the mean ± SEM on two independent experiments. (B) Tumorspheres per FOV were manually, single-blindly counted in GSC#1, GSC#4, and GSC#9 treated as in A. Data are presented as the mean ± SEM of three independent experiments. Each dot (n > 25) represents one sample count. (C) Silencing efficiency is shown by Western blot for GSC#1 and GSC#4 transfected with nonsilencing (sic, black) or GP130 targeting siRNA duplexes (siGP130, blue). (D) Tumorspheres per FOV were manually, single-blindly counted in GSC#1 and GSC#9, as treated in C, in MF medium, in mitogen-containing medium (NS34) and MF containing APLN (1 µM, APLN). Data are presented as the mean ± SEM of three independent experiments. Each dot (n > 25) represents one sample count. (E) Schematic representation of the GP130 (IL6ST) gene, with positioning of the CRISPR sequence guide at the junction between intro and exon8 (underlined sequence), that encodes for the N-terminal part of the extracellular domain. Genomic sequences in WT and two bi-allelic clones (KO#2 and #7) are shown. TM, transmembrane domain. (F) Flow cytometry analysis in WT and GP130 KO (#2 and #7) GSC#1. Histogram plots are represented with isotype Ig (red) and GP130 staining (blue). (G) Western blot analysis of total protein lysates from WT and GP130 KO (#2 and #7) GSC#1 using the indicated antibodies. Both GAPDH and STAT3 serve as loading controls. (H) LDA were performed in WT (green) and GP130 KO (#2, black, and #7, red) GSC#1 in APLN-only containing medium. Plot is representative of two independent experiments. (I) Tumorspheres per FOV were manually, single-blindly counted in WT and GP130 KO (#2 and #7) GSC#1, cultured in MF and APLN-only medium. Data are presented as the mean ± SEM of three independent experiments. Each dot (n > 25) represents one sample count. (J) Western blot analysis of total protein lysates from WT and GP130 KO#2 cells in APLN-only containing medium (2 d) using the indicated antibodies. Both TUBULIN and STAT3 serve as loading controls. All data are representative of at least three independent experiments, unless otherwise stated. ***, P < 0.001; **, P < 0.01; *, P < 0.05 using ANOVA tests.

