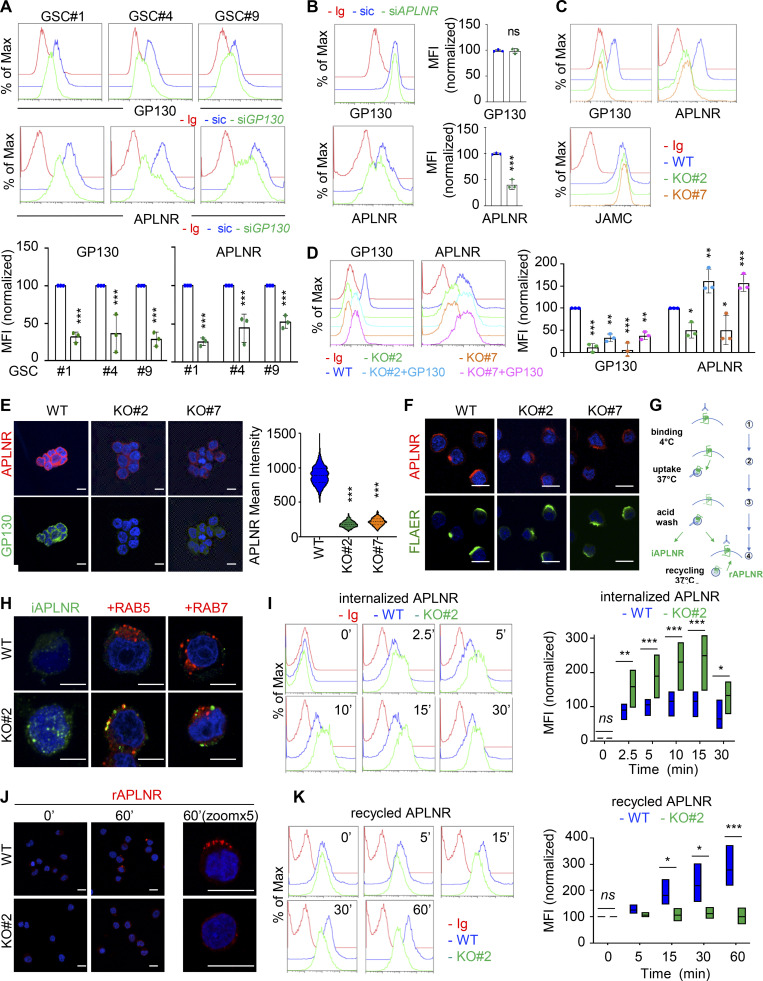
Figure 3.
GP130 contributes to APLNR availability at the plasma membrane. (A) Flow cytometry analysis of APLNR and GP130 in patient-derived GSCs (mesenchymal GSC#1, mesenchymal GSC#4, and classical GSC#9) transfected with nonsilencing (sic, blue) and GP130 targeting siRNA duplexes (siGP130, green). Ig control staining plots are shown (red). Histograms present the mean fluorescence intensity (MFI) normalized to respective sic conditions for GP130 and APLNR staining as indicated. Data are presented as the mean ± SEM of three independent experiments. (B) Flow cytometry analysis of APLNR and GP130 in GSC#1 transfected with nonsilencing (sic, blue) and APLNR targeting siRNA duplexes (siAPLNR, green). Ig control staining plots are shown (Ig, red). Data are representative of three independent experiments. (C) Flow cytometry analysis of GP130, APLNR and JAMC in WT (blue) and GP130 KO (#2, green, and #7, orange) GSC#1. Ig control staining plots are shown (Ig, red). Data are representative of three independent experiments. (D) Flow cytometry analysis of GP130 and APLNR in GSC#1 WT (parental, blue), GP130 KO (#2, green, and #7, orange), and GP130 KO reconstituted with GP130 cDNA (#2+GP130, light blue, and #7+GP#130, pink). Ig control staining plots are shown (Ig, red). Data are representative of three independent experiments. Histograms present the MFI normalized to respective sic conditions for GP130 and APLNR staining as indicated. Data are presented as the mean ± SEM on three independent experiments. (E) Confocal analysis of GP130 (green), APLNR (red) and nuclei (DAPI, blue) in WT and GP130 KO (#2 and #7) permeabilized GSC#1. Scale bars, 10 µm. Fluorescence mean intensity for APLNR signal (arbitrary unit) was quantified by high-content microscopy in WT and GP130 KO (#2 and #7) GSC#1 and represented as violin diagram. Lines delineate the mean. Data are representative of three independent experiments, with n > 950 cells. (F) WT and GP130 KO (#2 and #7) GSC#1 were fixed and analyzed by confocal microscopy for GPI-enriched domains (FLAER, green) and APLNR (red). Nuclei are shown in blue (DAPI). Scale bars, 10 µm. Data are representative of at least three independent experiments. (G) Schematic diagram for the anti-APLNR uptake to analyze internalization (iAPLNR) and further recycling (rAPLNR). (H) Anti-APLNR antibody uptake (iAPLNR, green) was assessed in WT and GP130 KO#2 cells after 15 min at 37°C. Following acid wash and fixation, cells were stained for RAB5 (red) or RAB7 (red) and analyzed by confocal microscopy. Nuclei are shown in blue (DAPI). Merge images are shown. Scale bars, 5 µm. Data are representative of three independent experiments. (I) Similarly, anti-APLNR antibody uptake was assessed by flow cytometry after incubation at 37°C at the indicated times (0, 2.5, 5, 10, 15, and 30 min) in WT (blue) and GP130 KO#2 (green) GSC#1. Ig control staining plots are shown (red). Data are representative of three independent experiments. Boxplots depict the APLNR uptake in WT (blue) and GP130 KO#2 (green) GSC#1, calculated from normalized MFI at the indicated time points (minutes) following 37°C incubation. Line delineates the mean, and boxes show upper and lower quartiles. (J) Anti-APLNR antibody recycling (rAPLNR, red) was evaluated in WT and GP130 KO#2 cells after a 60-min chase at 37°C (following a 15-min pulse at 37°C and acid washes, as depicted in G). Cells were fixed and not permeabilized to analyze recycling APLNR (red) by confocal microscopy. Nuclei are shown in blue (DAPI). Merge images are shown. Scale bars, 10 µm. (K) Similarly, anti-APLNR antibody recycling was assessed by flow cytometry after incubation at 37°C at the indicated times (0, 5, 15, 30, and 60 min) in WT (blue) and GP130 KO#2 (green) GSC#1. Ig control staining plots are shown (red). Data are representative of three independent experiments. Boxplots depict the APLNR recycling in WT (blue) and GP130 KO#2 (green) GSC#1, calculated from normalized MFI at the indicated time points (minutes) following 37°C chasing incubation. Line delineates the mean, and boxes show upper and lower quartiles. All data are representative of at least three independent experiments. ***, P < 0.001; **, P < 0.01; *, P < 0.05 using ANOVA tests.

