Figure 4.
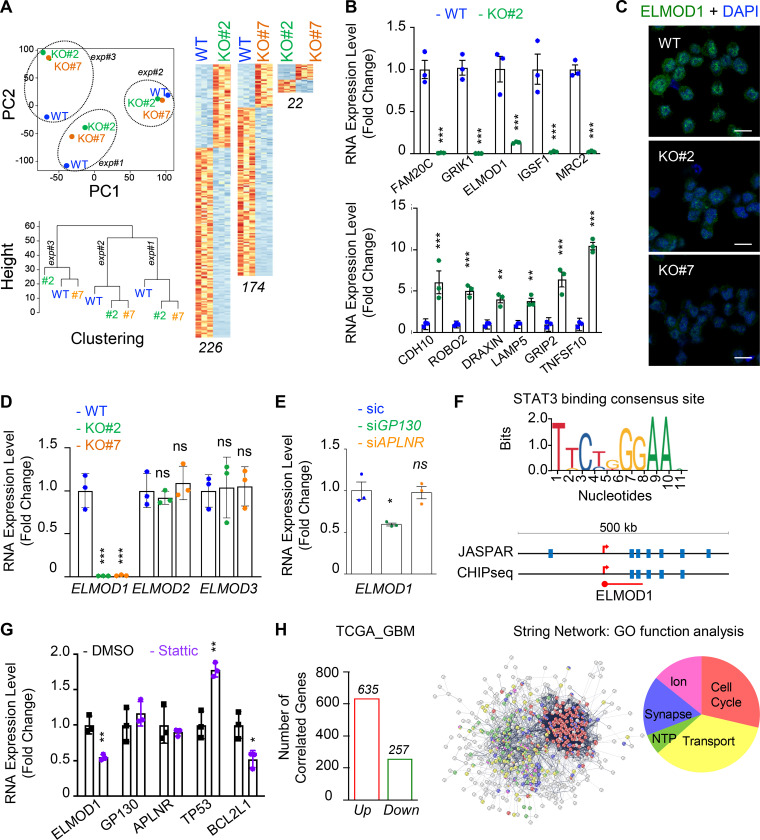
ELMOD1 is modulated by GP130 expression. (A) RNA was extracted from three independent batches of WT (blue) and GP130 KO (#2, green; and #7, orange) patient-derived GSCs (mesenchymal GSC#1) and analyzed by RNA-seq. Representation of principal-component (PC) analysis and nonsupervised clustering show are shown. “Up” (orange) and “down” (blue) differentially expressed genes are also represented by pairs. n (226, 174, and 22) indicates the number of differentially expressed genes for each comparison. (B) qPCR analysis of up- and down-regulated hits in WT (blue) and GP130 KO#2 (green) GSC#1. Data are presented as the mean ± SEM fold change of three independent experiments using ACTB and HPRT1 as housekeeping genes for normalization. (C) Confocal analysis of ELMOD1 (green) and nuclei (DAPI, blue) in WT and GP130 KO (#2 and #7). Data are representative of three independent experiments. Scale bars, 10 µm. (D) qPCR analysis of ELMOD1, ELMOD2, and ELMOD3 in WT (blue) and GP130 KO (#2, green; and #7, orange). Data are presented as the mean ± SEM fold change on three independent experiments using ACTB and HPRT1 as housekeeping genes for normalization. (E) qPCR analysis of ELMOD1 in GSC#1 transfected with nonsilencing (sic, green) and either GP130 (green) or APLNR (orange) targeting siRNA duplexes. Data are presented as the mean ± SEM fold change of three independent experiments using ACTB and HPRT1 as housekeeping genes for normalization. (F) STAT3 consensus binding sequence was obtained from JASPAR, while putative sites were predicted around ELMOD1 gene using JASPAR and ENCODE (transcription factor ChIP-seq database). (G) qPCR analysis of the ELMOD1, APLNR, and GP130 and known STAT3 target genes (TP53 and BCL2L1) in GSC#1 treated with DMSO (1%, overnight, black) and STAT3 inhibitor (Stattic, 8 μM, overnight, purple). Data are presented as the mean ± SEM fold change of three independent experiments, using ACTB and HPRT1 as housekeeping genes for normalization. (H) Number of coregulated genes (635 “Up,” red, and 257 “Down,” green) with ELMOD1 expression in 489 patients from the cancer genome atlas for glioblastoma (TCGA_GBM) database. Search tool for the retrieval of interacting genes/proteins (STRING) analysis of the coregulated genes is shown, together with the main gene ontology (GO) functions. All data are representative of at least three independent experiments. ***, P < 0.001; **, P < 0.01; *, P < 0.05 using ANOVA tests.

