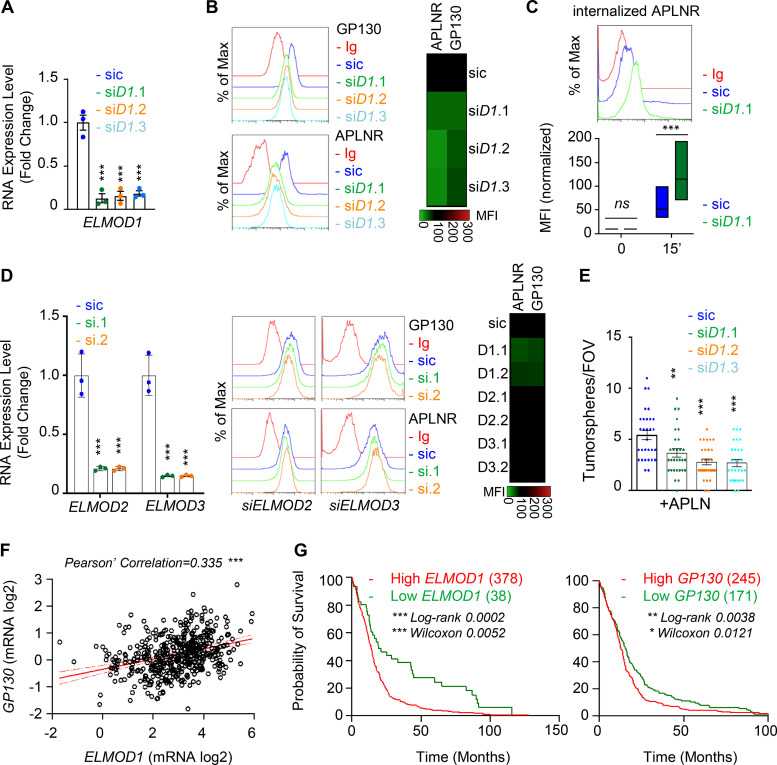
Figure 5.
ELMOD1 is involved in the GP130-dependent trafficking of APLNR. (A) qPCR analysis of ELMOD1 in GSC#1 transfected with nonsilencing (sic, dark blue) and three independent ELMOD1 targeting siRNA duplexes (siD1.1, siD1.2, and siD1.3, in green, orange, and light blue, respectively). Data are presented as the mean ± SEM fold change of three independent experiments using ACTB and HPRT1 as housekeeping genes for normalization. (B) Flow cytometry analysis of APLNR and GP130 in sic (dark blue) and siELMOD1 (seq.1, 0.2, and 0.3, in green, orange, and light blue, respectively). Ig control staining plots are shown (red). Data are representative of at least three independent experiments. Heatmap recapitulates the mean MFI for GP130 and APLNR staining as indicated, normalized to sic, in three independent experiments. (C) Flow cytometry analysis of anti-APLNR uptake in sic (blue) and siELMOD1 (green) GSC#1 upon 15-min incubation at 37°C. Ig control staining plots are shown (red). Boxplots depict the uptake of the anti-APLNR uptake at the indicated time points (15 min) following 37°C incubation. Line delineates the mean, and boxes show upper and lower quartiles. Data are representative of four independent experiments. (D) qPCR analysis of ELMOD2 and ELMOD3 in GSC#1 transfected with nonsilencing (sic, dark blue) and ELMOD2 or ELMOD3 targeting siRNA duplexes (seq.1, and 0.2, in green and orange, respectively). Data are presented as the mean ± SEM fold change of three independent experiments using ACTB and HPRT1 as housekeeping genes for normalization. Flow cytometry analysis of APLNR and GP130 in sic (blue) and siELMOD2 or D3 targeting siRNA duplexes (seq.1 and 0.2, in green and orange, respectively). Ig control staining plots are shown (red). Heatmap recapitulates the MFI for GP130 and APLNR staining as indicated, normalized to sic, in three independent experiments. (E) Tumorspheres per FOV were manually, single-blindly counted in similarly transfected cells with sic (dark blue), ELMOD1 targeting duplexes, and siELMOD1 (seq.1, 0.2, and 0.3, in green, orange, and light blue, respectively) cultured in MF APLN-only medium. Data are presented as the mean ± SEM of three independent experiments. Each dot (n > 25) represents one sample count. (F) Scatterplot shows the linear correlation between GP130 and ELMOD1 RNA level in 489 GBM patients from TCGA_GBM database. (G) Kaplan–Meier survival curves validate the prognostic value of GP130 and ELMOD1 genes when overexpressed in 416 GBM patients. All data are representative of at least three independent experiments. ***, P < 0.001; **, P < 0.01; *, P < 0.05 using ANOVA tests, unless specified.

