Figure S3.
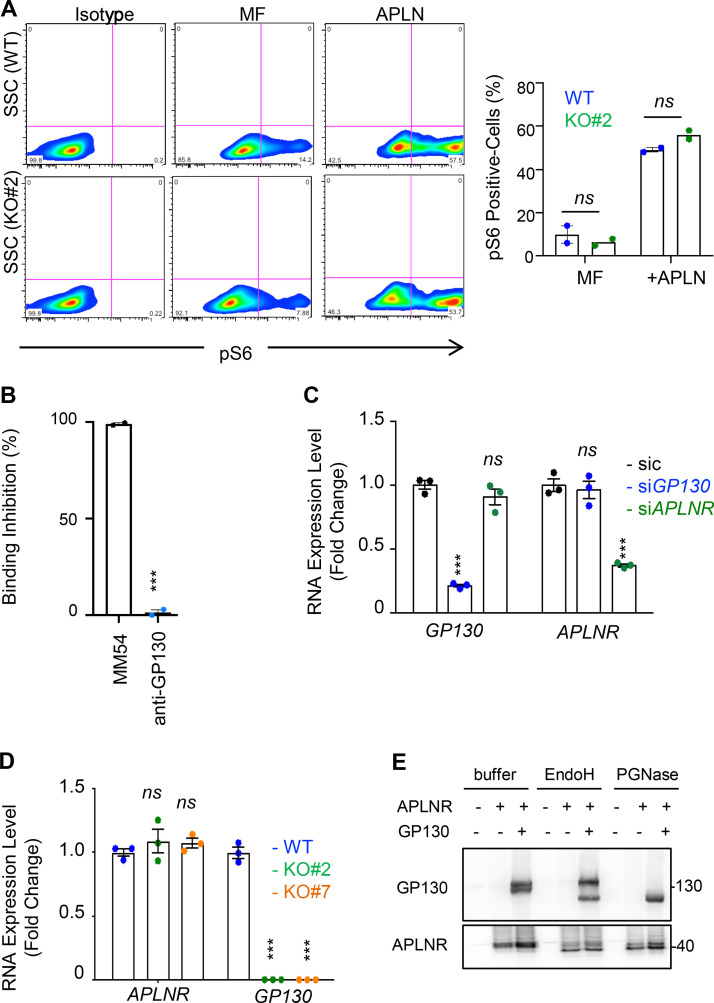
GP130 does not affect all APLN/APLNR signaling activities. (A) S6 phosphorylation was monitored by flow cytometry in WT (blue) and GP130 KO#2 (green) patient-derived GSCs (mesenchymal GSC#1) cultured in MF conditions and MF containing APLN only (1 µM). Isotype staining is also shown as a control for gating. Histogram represents the mean ± SEM percentage of phospho S6 ribosomal protein (pS6)–positive cells in two independent experiments. SSC, side scatter. (B) A radioligand binding assay of APLN to APLNR was measured in the presence of the either competitive APLNR antagonist (MM54, black) or anti-GP130 antibodies (blue) in APLNR–stably expressing cells. Data are expressed as the mean ± SEM percentage of binding inhibition on technical duplicates. (C) Patient-derived GSCs (mesenchymal GSC#1) transfected with nonsilencing (sic, black) and either GP130 or APLNR targeting siRNA duplexes (siGP130, blue and siAPLNR, green) were analyzed by qPCR for APLNR and GP130. Data are presented as the mean ± SEM fold change of three independent experiments using ACTB and HPRT1 as housekeeping genes for normalization. (D) qPCR was performed in WT (blue) and GP130 KO (#2, green; and #7, orange) GSC#1. Data are presented as the mean ± SEM fold change of three independent experiments using ACTB and HPRT1 as housekeeping genes for normalization. (E) HEK293T cells were transfected with GP130 and/or APLNR encoding plasmids. Protein lysates were incubated with buffer, EndoH or PGNase, and further analyzed by Western blot, as indicated. All data are representative of at least three independent experiments. ***, P < 0.001 using ANOVA tests.

