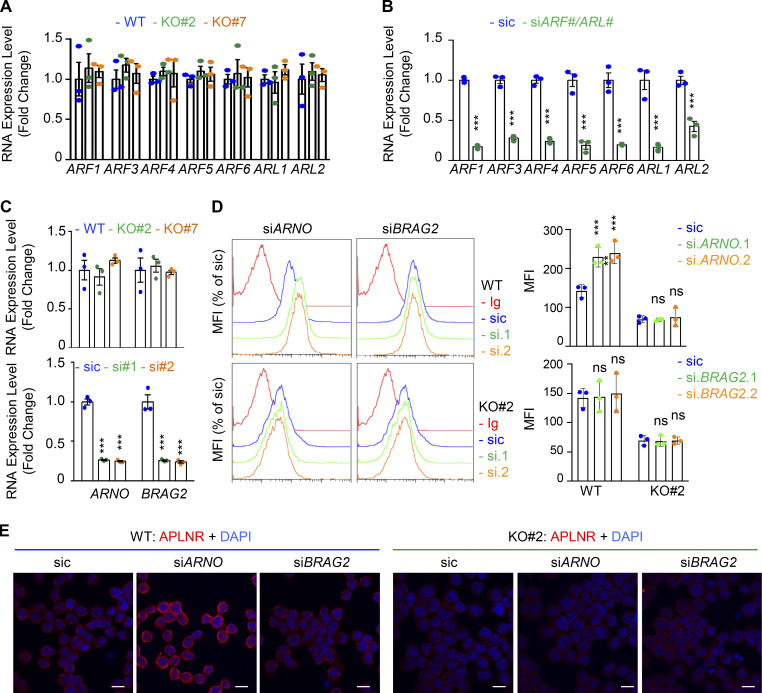
Figure S5.
Modulation of APLNR membrane expression by ARF-related GEFs. (A) qPCR analysis of ARFs1-6 and ARLs1-2 in WT (blue) and GP130 KO (#2, green; and #7, orange) GSC#1. Data are presented as the mean ± SEM fold change of three independent experiments using ACTB and HPRT1 as housekeeping genes for normalization. (B) qPCR analysis of the indicated targets in GSC#1 transfected with nonsilencing (sic) and indicated siRNA duplexes. Data are presented as the mean ± SEM fold change of three independent experiments using ACTB and HPRT1 as housekeeping genes for normalization. (C) qPCR analysis of ARNO (CYTH2) and BRAG2 (IQSEC1) GSC#1 transfected with nonsilencing (sic) and respective siRNA duplexes. Data are presented as the mean ± SEM fold change of three independent experiments using ACTB and HPRT1 as housekeeping genes for normalization. (D) Flow cytometry analysis of APLNR in WT (blue) and GP130 KO#2 cells transfected with sic (blue) and ARNO and BRAG2 siRNA duplexes (green and orange, respectively). Ig control staining plots are shown (red). Histograms present the MFI normalized to respective sic conditions for APLNR staining as indicated. Data are presented as the mean ± SEM of three independent experiments. (E) Similarly treated cells were fixed (PBS) and further permeabilized (Triton) before analysis by confocal microscopy for APLNR (red) and nuclei (DAPI, blue). Scale bars, 10 µm. All data are representative of at least three independent experiments. ns, P > 0.05; ***, P < 0.001 using ANOVA tests.

