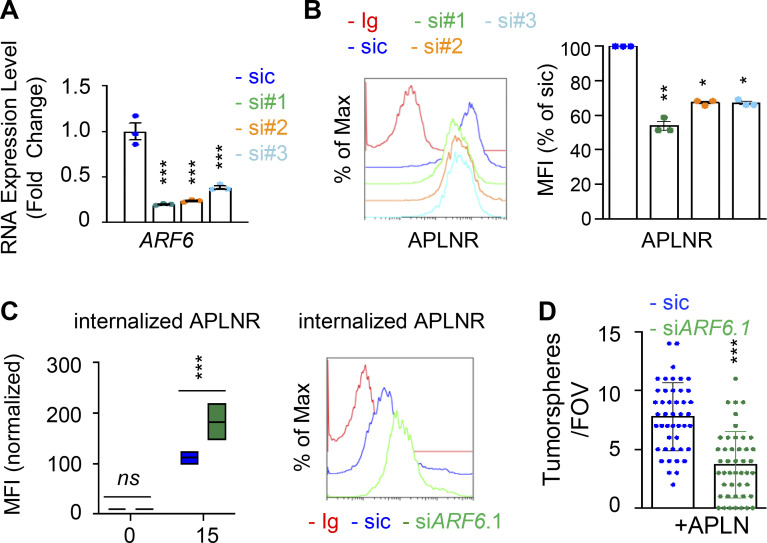
Figure S6.
ARF GTPases contribute to APLNR availability at the plasma membrane. (A) qPCR analysis of ARF6 in GSC#1 transfected with nonsilencing (sic, dark blue) and three independent ARF6 targeting siRNA duplexes (si#1, si#2, and si#3, in green, orange, and light blue, respectively). Data are presented as the mean ± SEM fold change of three independent experiments using ACTB and HPRT1 as housekeeping genes for normalization. (B) Flow cytometry analysis of APLNR in sic (blue) and siARF6 (seq#1, #2, and #3, in green, orange, and blue, respectively). Ig control staining plots are shown (red). Histograms present the MFI normalized to respective sic conditions for APLNR staining as indicated. Data are presented as the mean ± SEM of three independent experiments. (C) Boxplots depict the uptake of the anti-APLNR uptake, in sic (blue) and siARF6 (green) GSC#1, at the indicated time points (15 min) following 37°C incubation. Line delineates the mean, and boxes show upper and lower quartiles. Data are representative of four independent experiments. Flow cytometry analysis of anti-APLNR uptake in sic (blue) and siARF6 (green) GSC#1 upon 15-min incubation at 37°C. Ig control staining plots are shown (red). Data are representative of four independent experiments. (D) Tumorspheres per FOV were manually, single-blindly counted in similarly transfected cells, cultured in APLN-only medium. Data are presented as the mean ± SEM of three independent experiments. Each dot (n > 25) represents one sample count. All data are representative of at least three independent experiments. ***, P < 0.001; **, P < 0.01; *, P < 0.05 using ANOVA tests.

