
Fig. 1. Intertemporal choice task design.
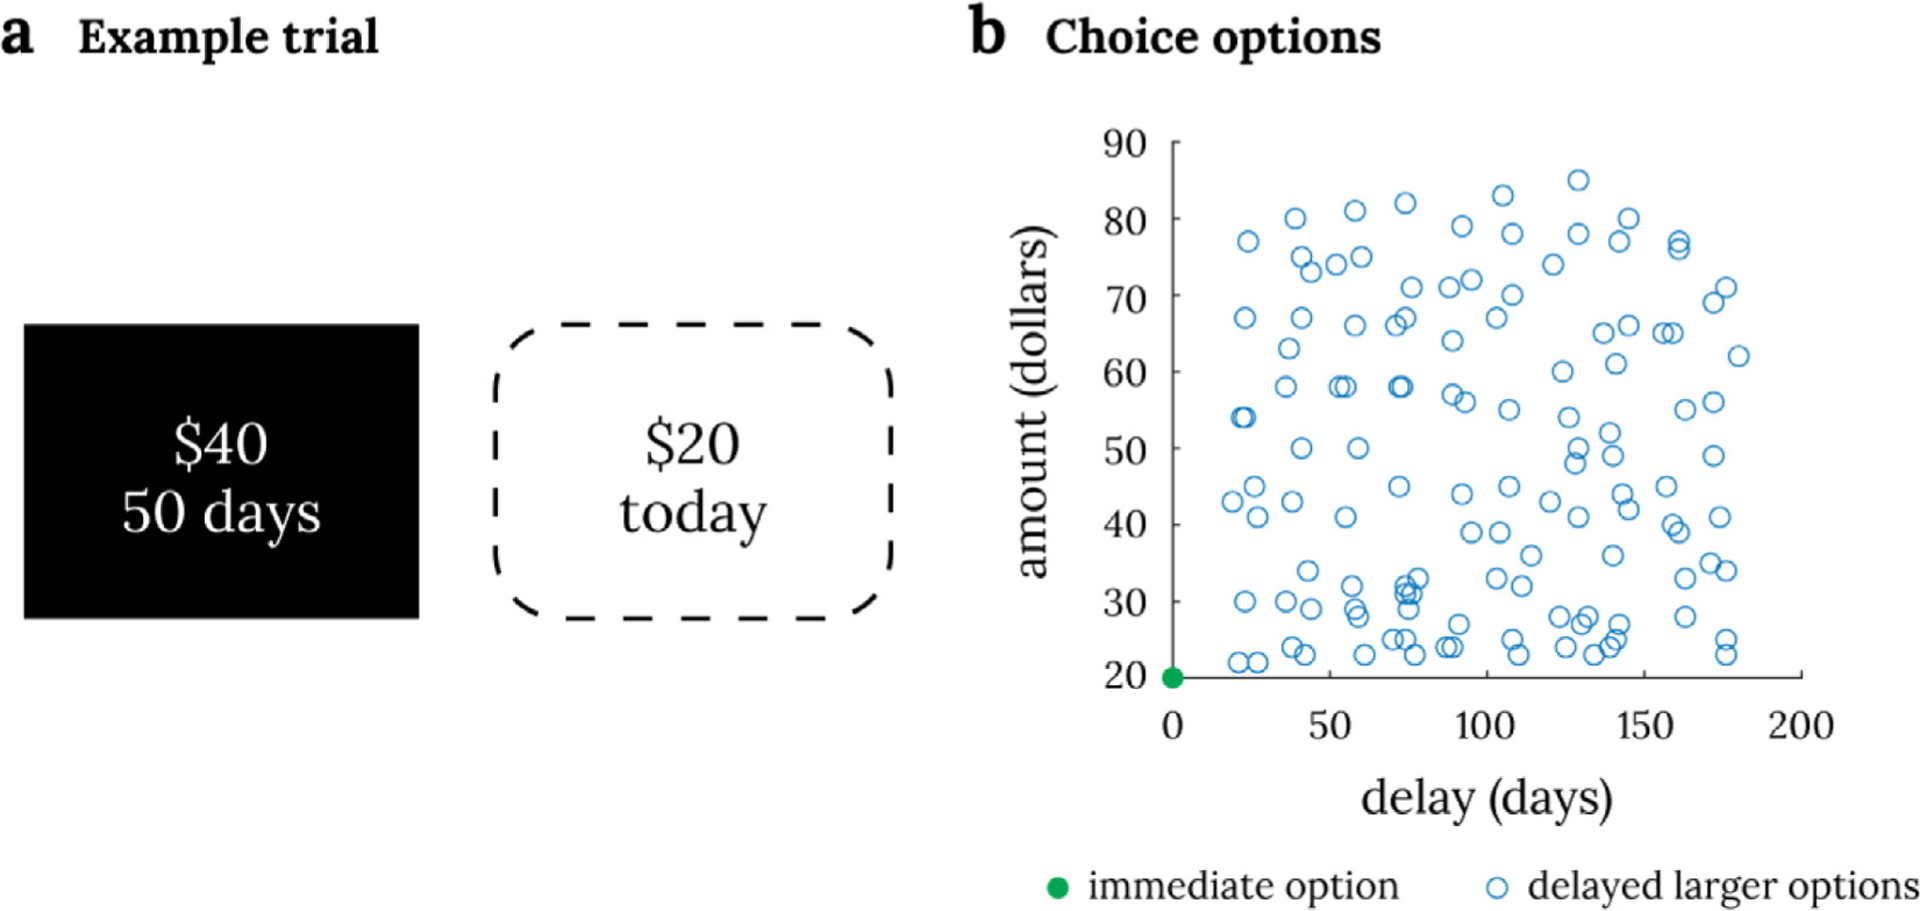
Panel a shows an example trial in intertemporal choice task where the delayed larger option is shown on the screen (black square). The immediate smaller option, which is the same on every trial, is not shown on the screen (dotted square). Panel b shows all 120 choice trials in the task. Each choice is between an immediate $20 option (green dot) and a delayed larger monetary option (one of the blue circles).