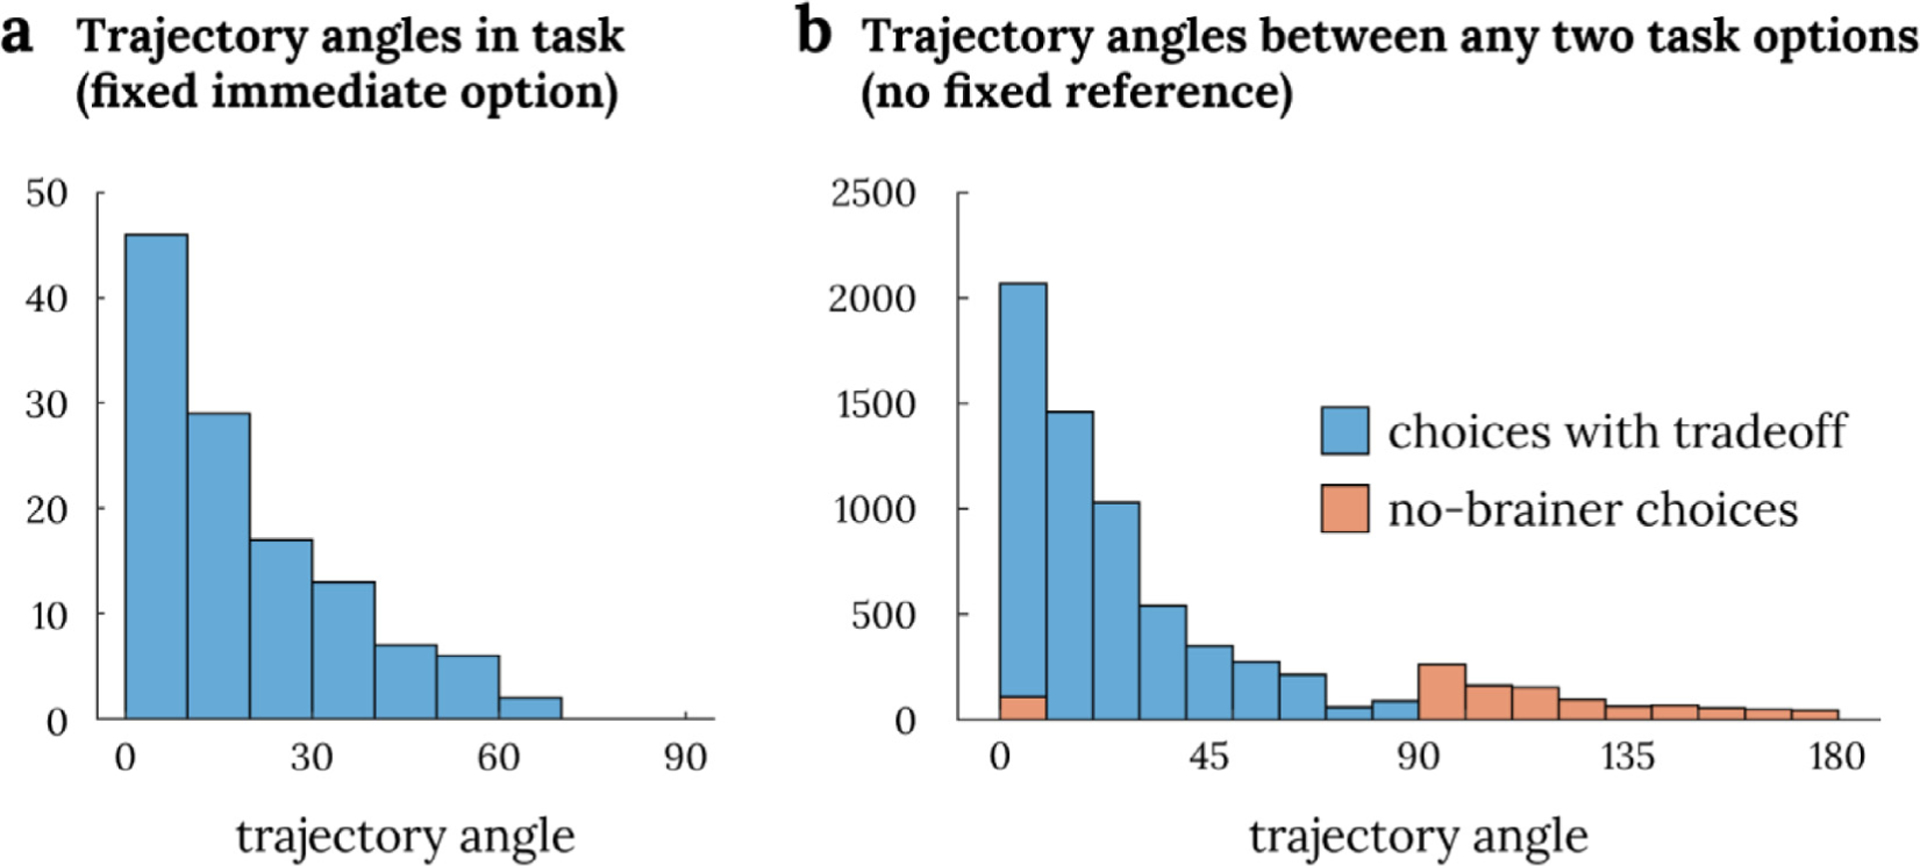
Fig. 3. Distribution of trajectory angles.

Panel a shows the distribution of trajectory angles in this task when traveling between the immediate option (green dot in Fig 1b) and the delayed options (blue circles in Fig 1b). Panel b shows the distribution of trajectory angles if two random options were to be chosen from the task space (i.e., two of the blue circles in Fig 1b). Trajectory angles between two options with a tradeoff are marked in blue while those between two options with no tradeoff (i.e., when one option dominates the other option) are marked in orange.
