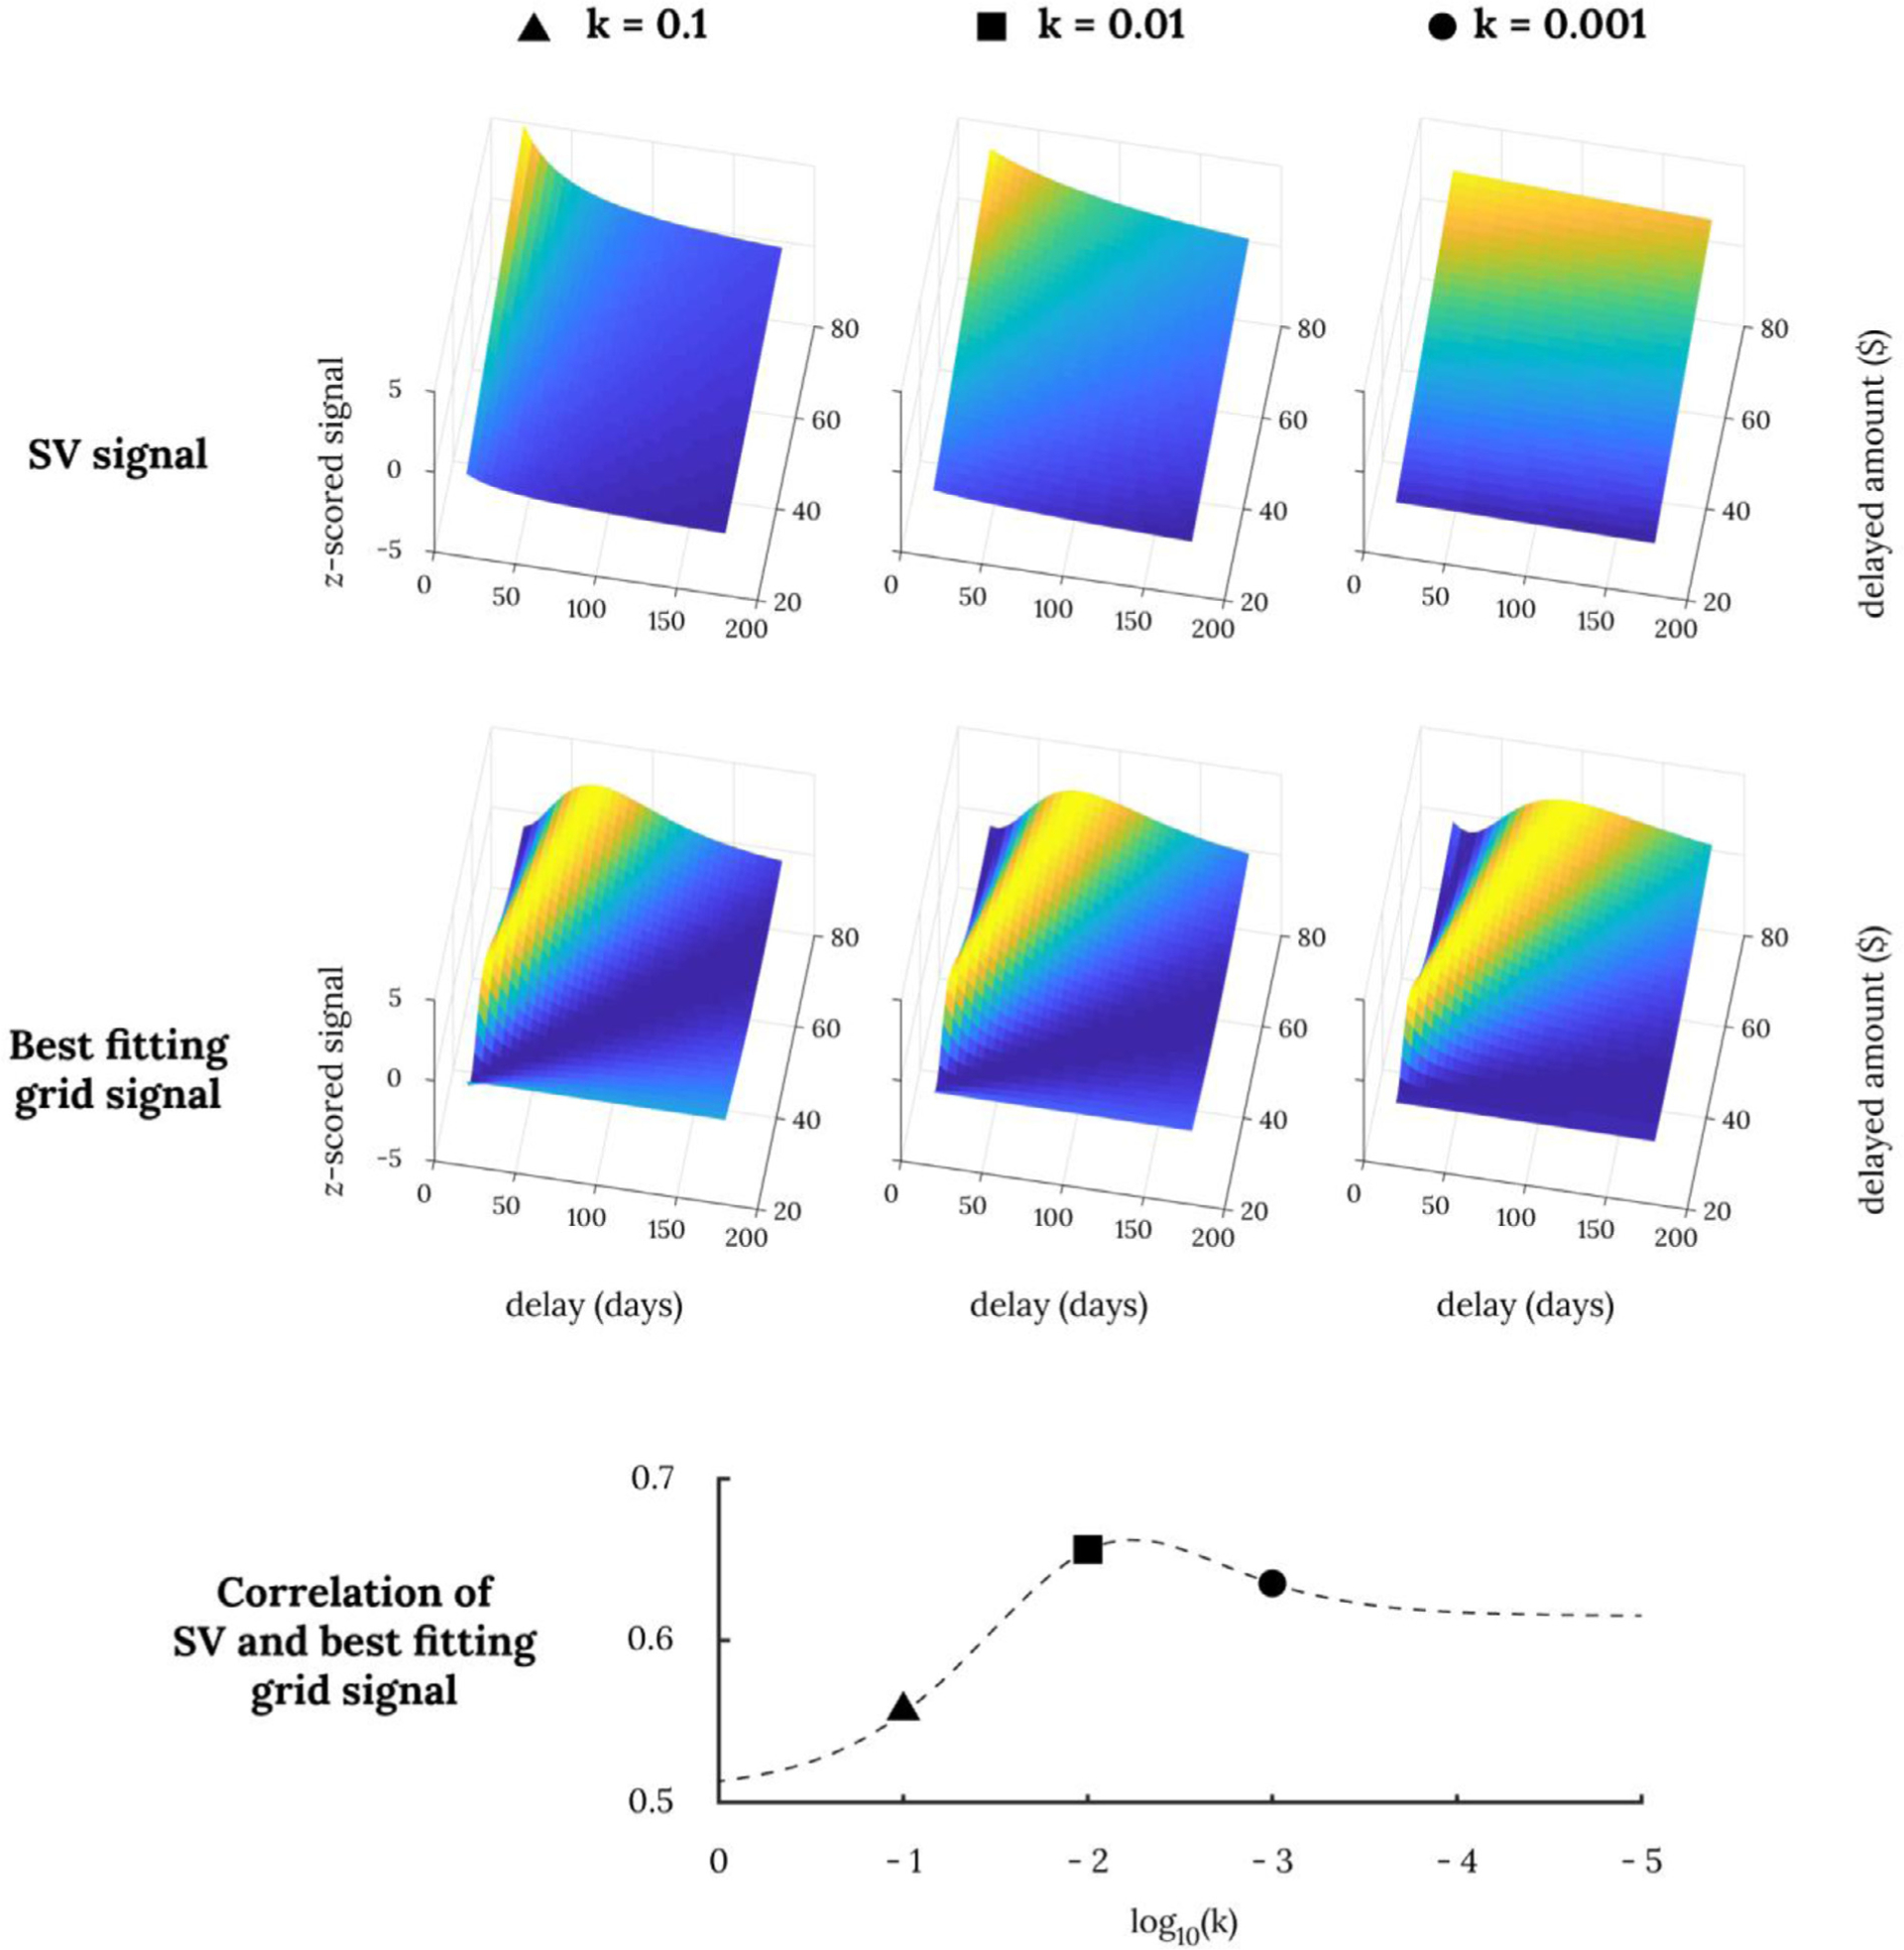
Fig. 4. Correlation between SV signal and its most similar hexagonal modulation signal.

The top three panels show simulated subjective value signals for various delayed amounts at various discount rates and the next three panels below show their respective best fitting hexagonal grid modulations. The correlations between the two signals are provided below in dotted lines across various discount rates.
