
Fig. 5. Regions with significant subjective value correlation (top) and significant hexagonal gridlike modulation (bottom) in session 1.
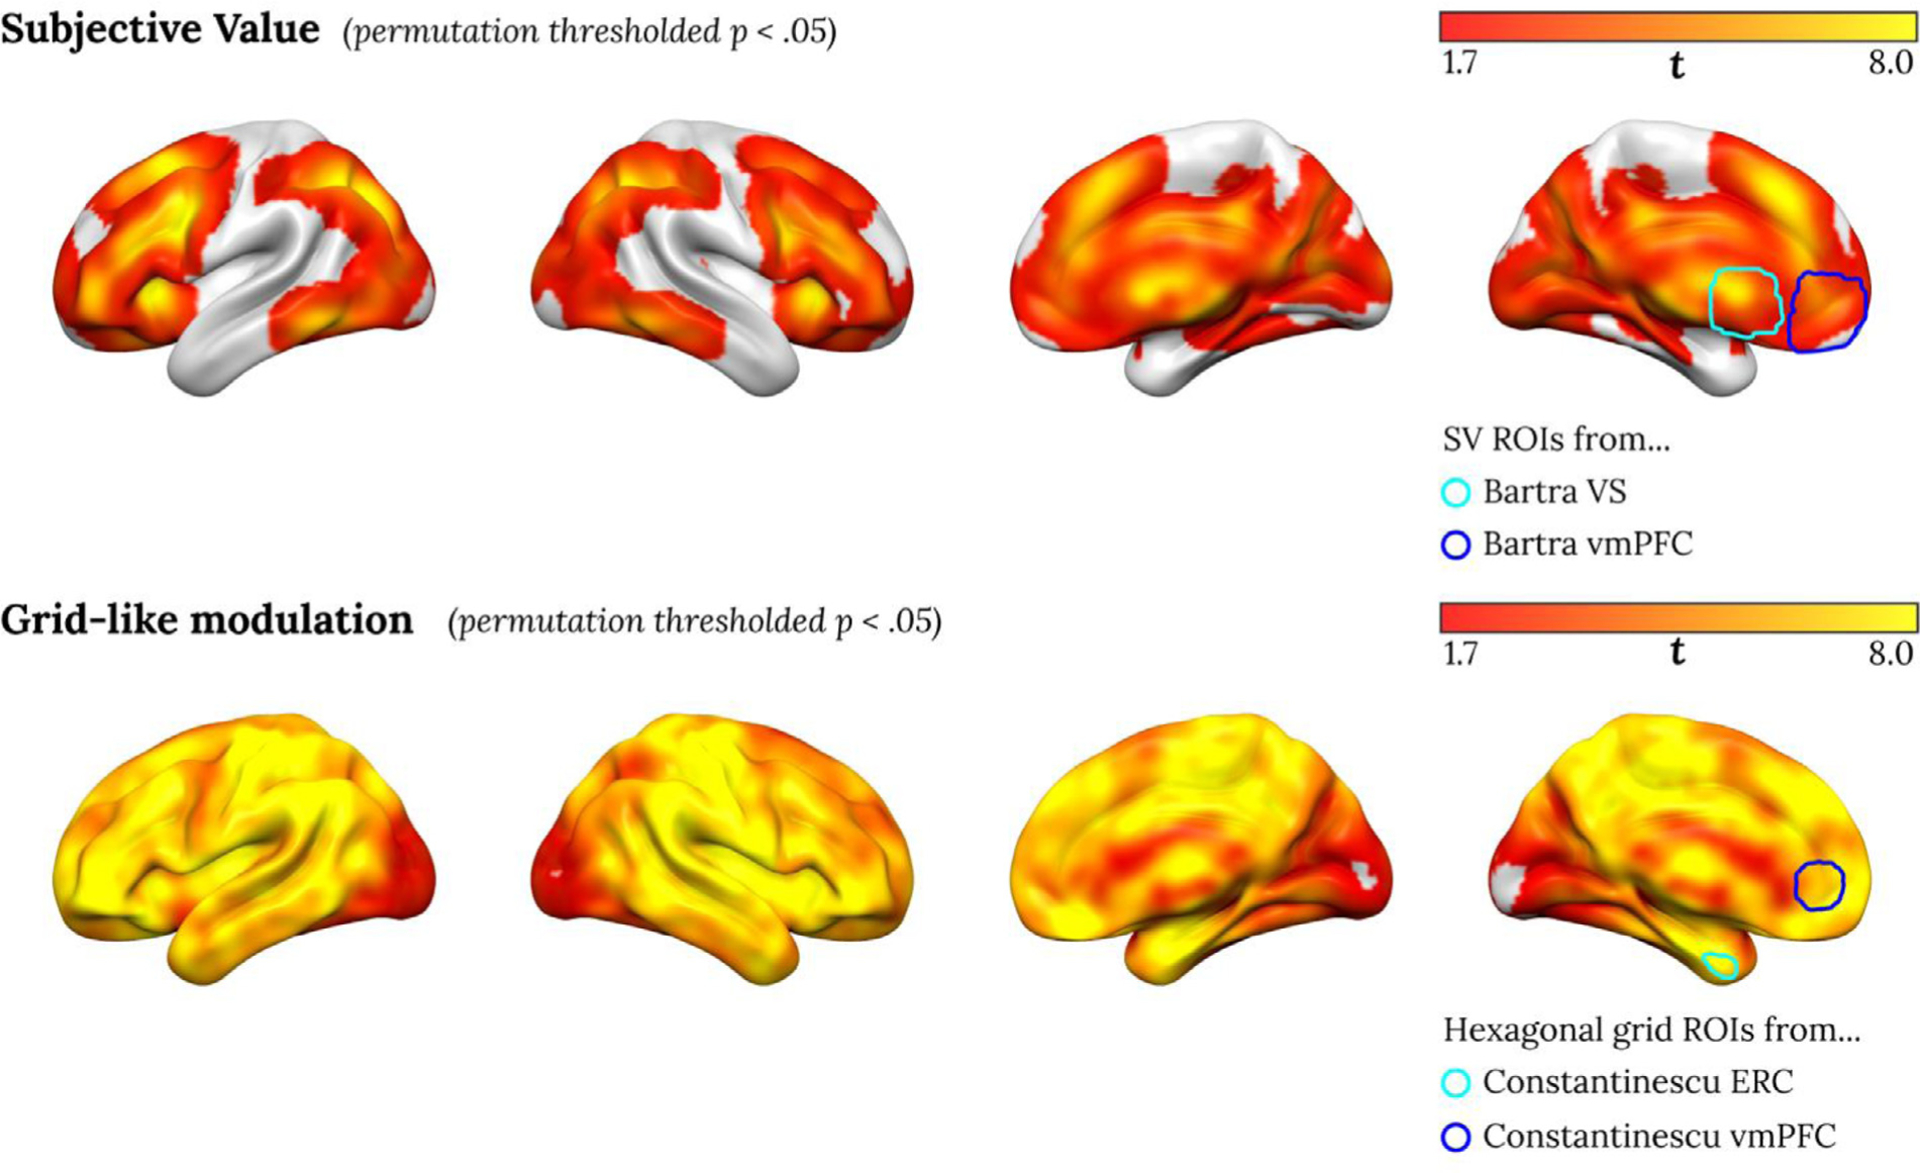
(p < 0.05 with permutation testing with threshold free cluster enhancement). The rightmost brain shows overlays of the two ROIs from Bartra et al. (2013) on top and the two ROIs from Constantinescu et al. (2016) on bottom.