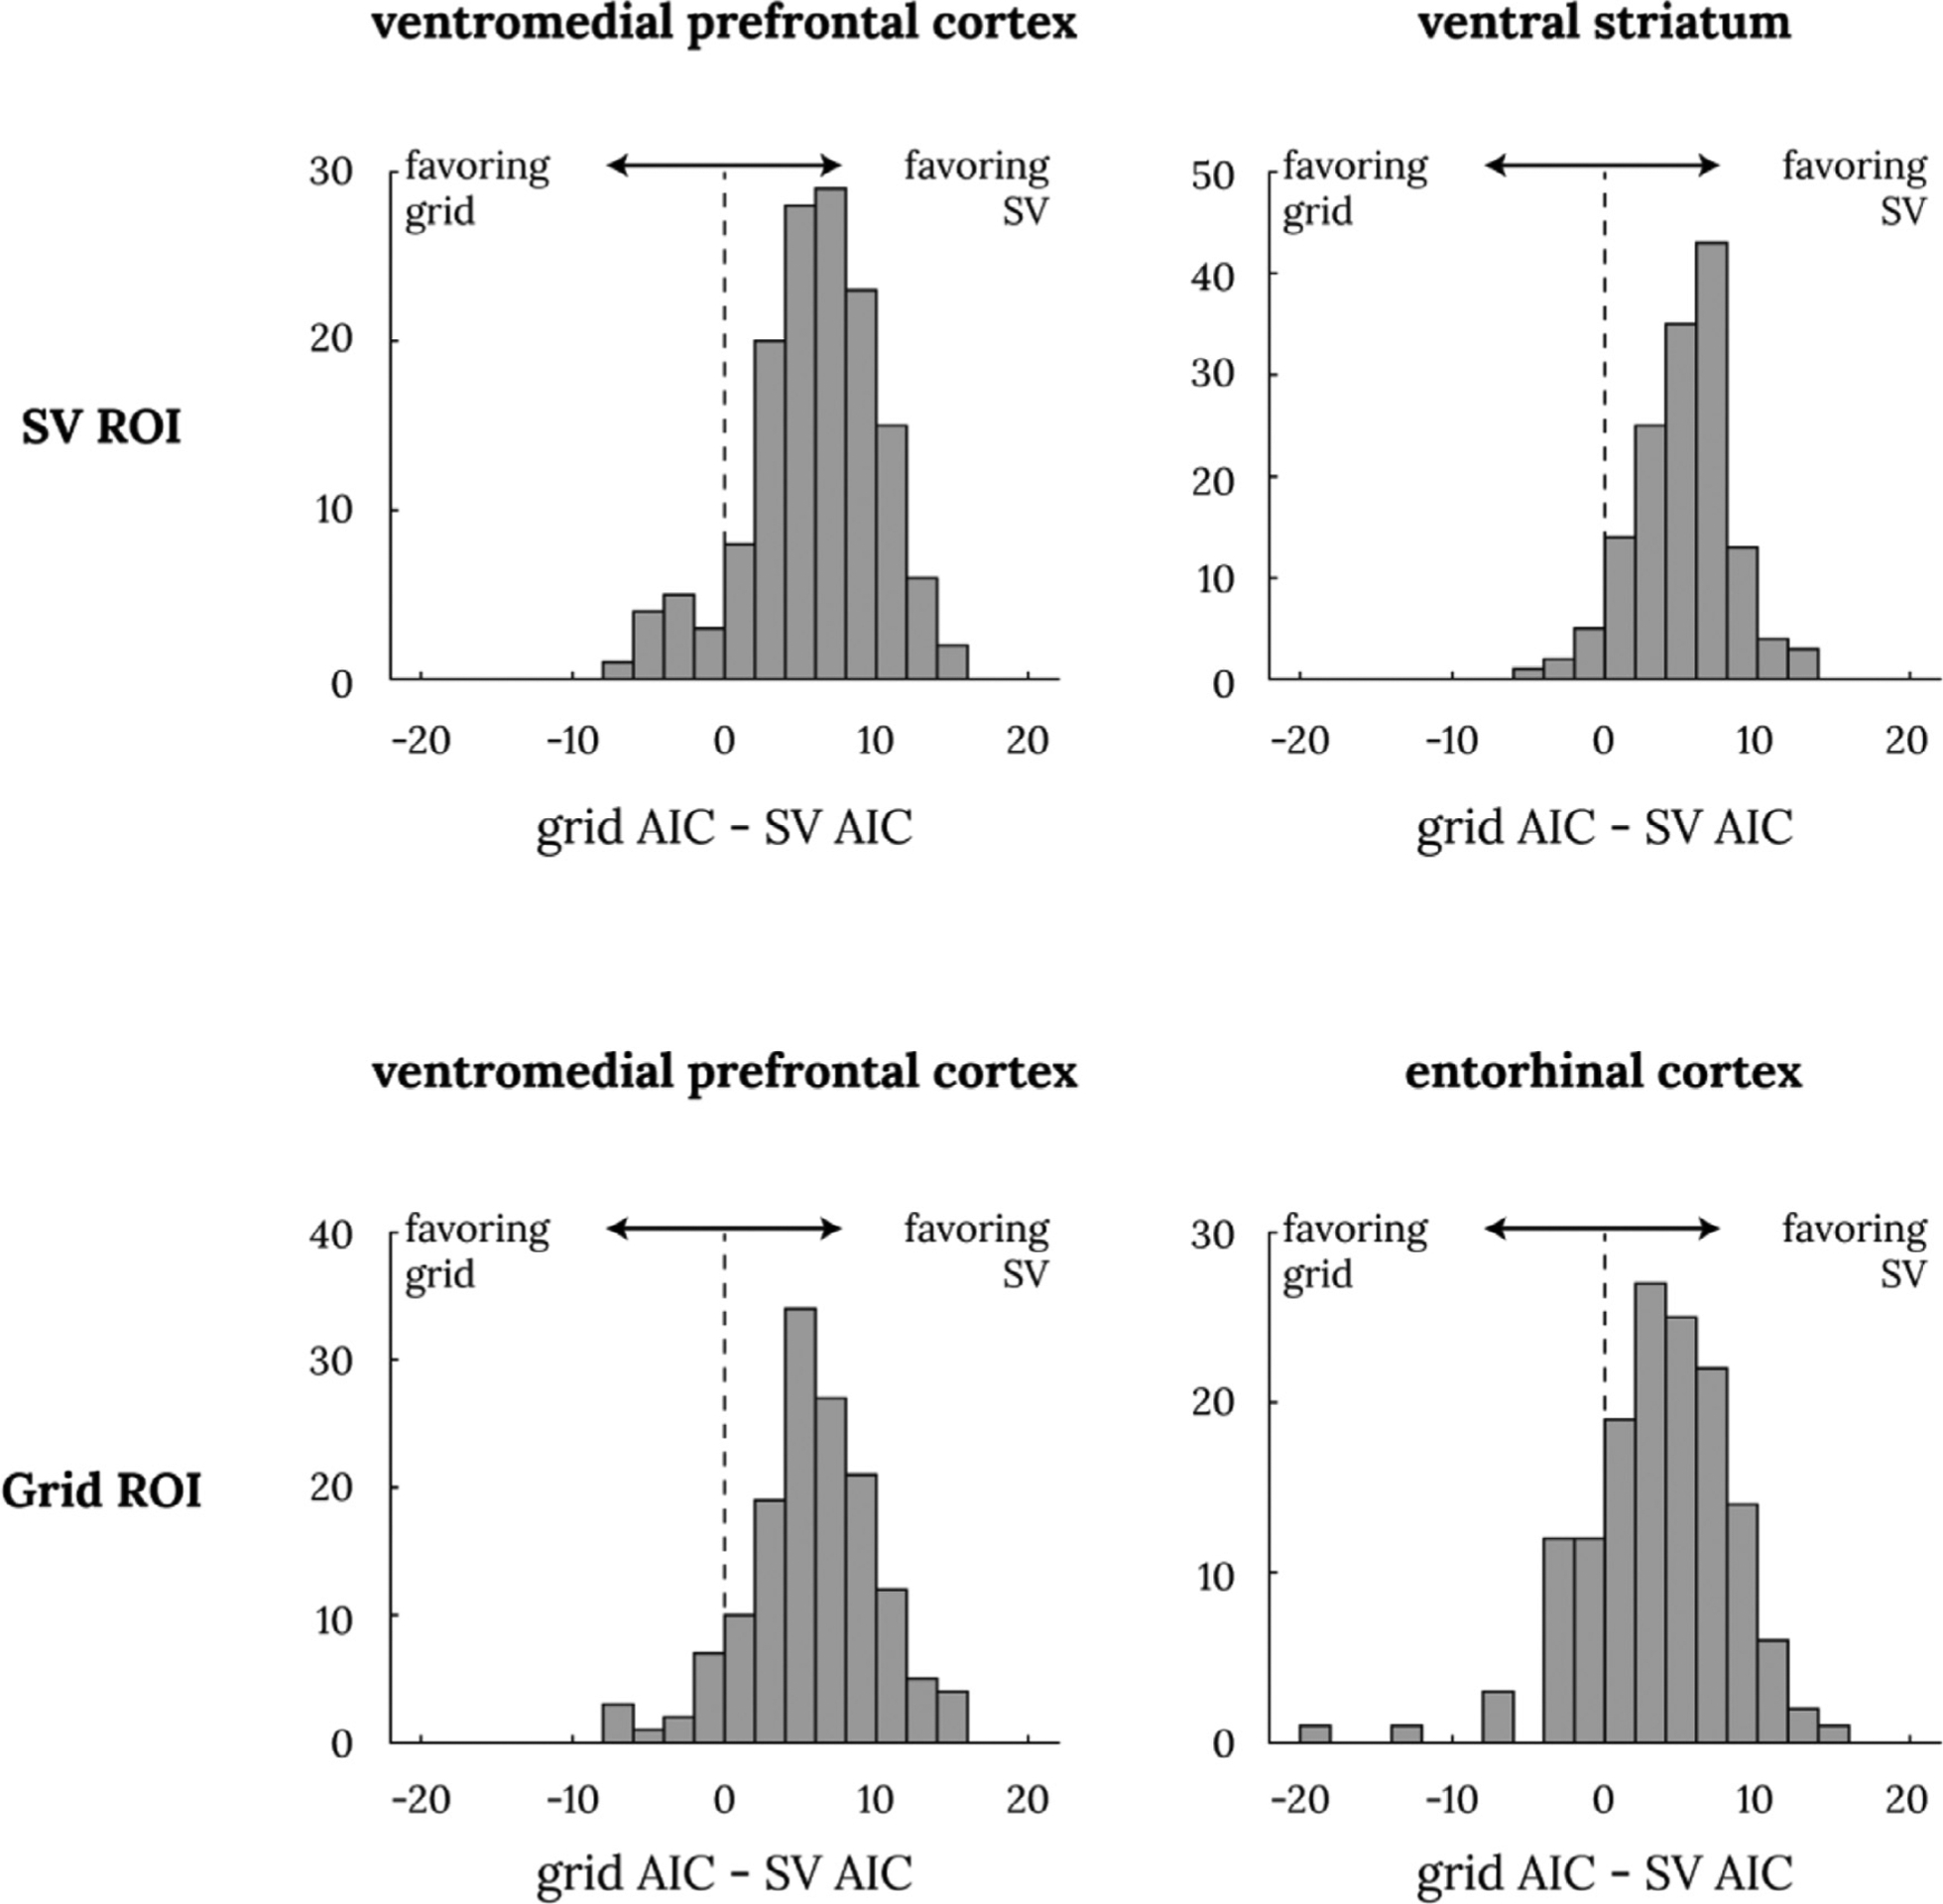
Fig. 6. Model comparison between subjective value GLM and hexagonal grid GLM.

Each of the four panels show the histogram of individual AIC differences between the hexagonal grid GLM and the subjective value GLM such that a positive number indicates AIC difference favoring the SV model. The top two panels are from the ROIs from Bartra et al. (2013); the bottom two panels are from the hexagonal grid ROIs from Constantinescu et al. (2016). All four ROIs’ mean AIC difference was significantly different from 0 at p ≪. 001 with a one-sample t-test.
