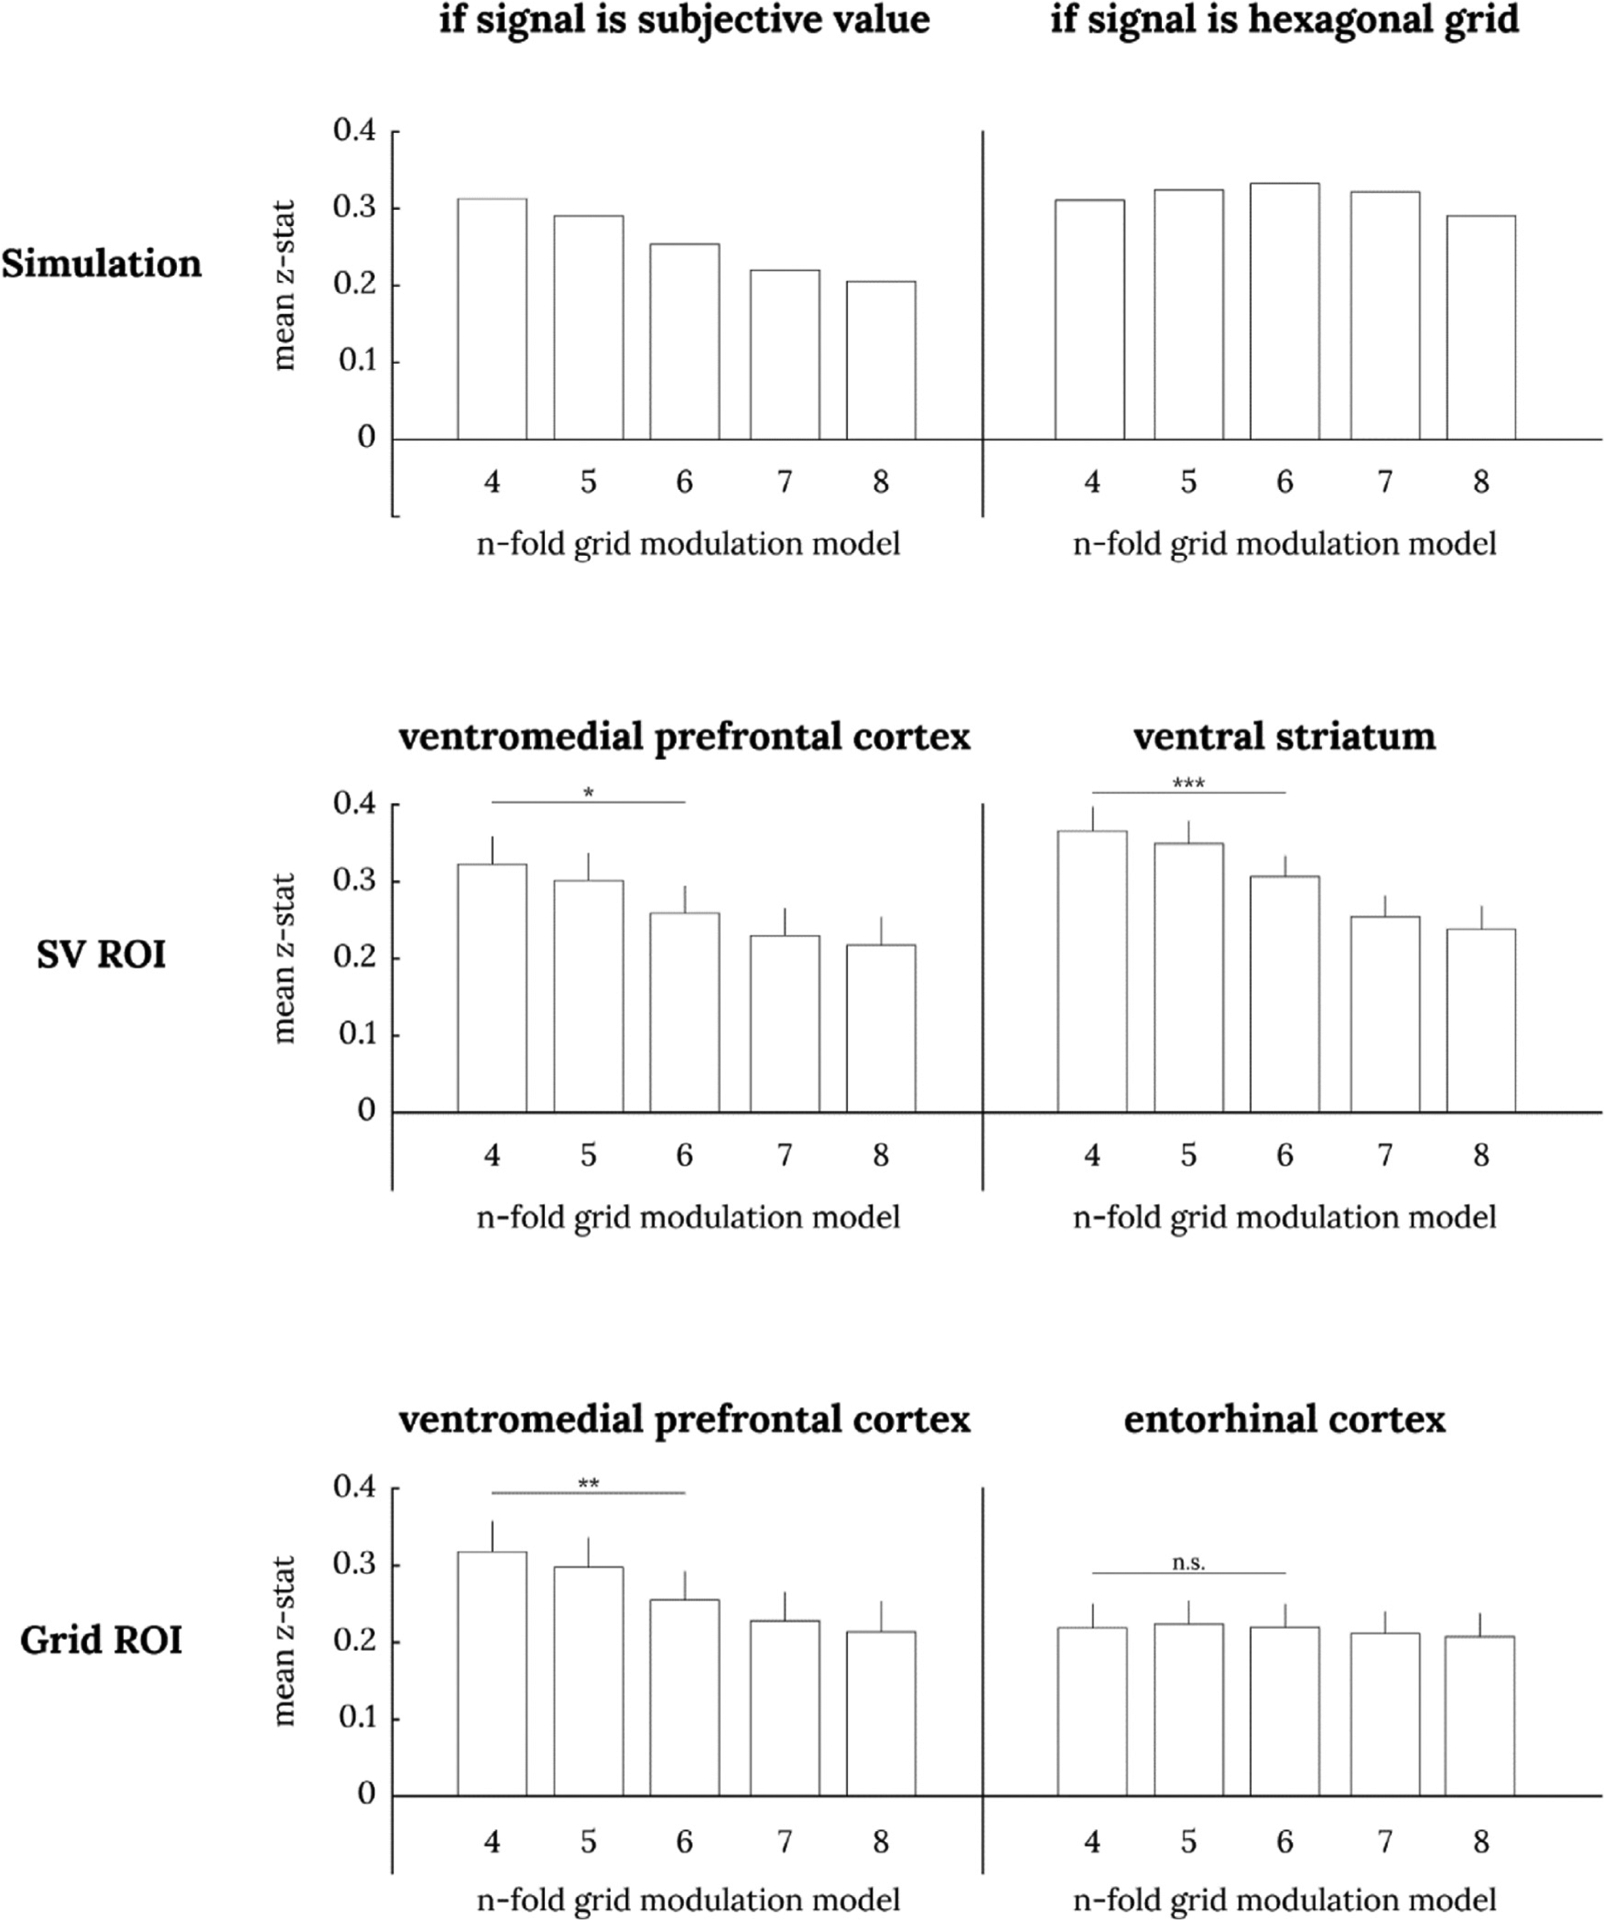
Fig. 7. Comparison of n-fold grid modulation GLMs in session 1 data.

The top two panels show simulated results of n-fold grid modulation GLMs when the true signal is SV (left) or a hexagonal gridlike code (right). When the true signal is subjective value, we expect a descending staircase pattern, and when the true signal is a hexagonal grid, we expect a pyramid pattern. The middle two panels show the GLM analysis in SV ROIs from Bartra et al. (2013); the bottom two panels show them for hexagonal grid ROIs from Constantinescu et al. (2016). The error bars denote the standard errors of the mean. Paired t-test between 4-fold and 6-fold: * p < .05, ** p < .01, *** p < .001. All 20 bars are significantly greater than zero (uncorrected p < .001 for all).
