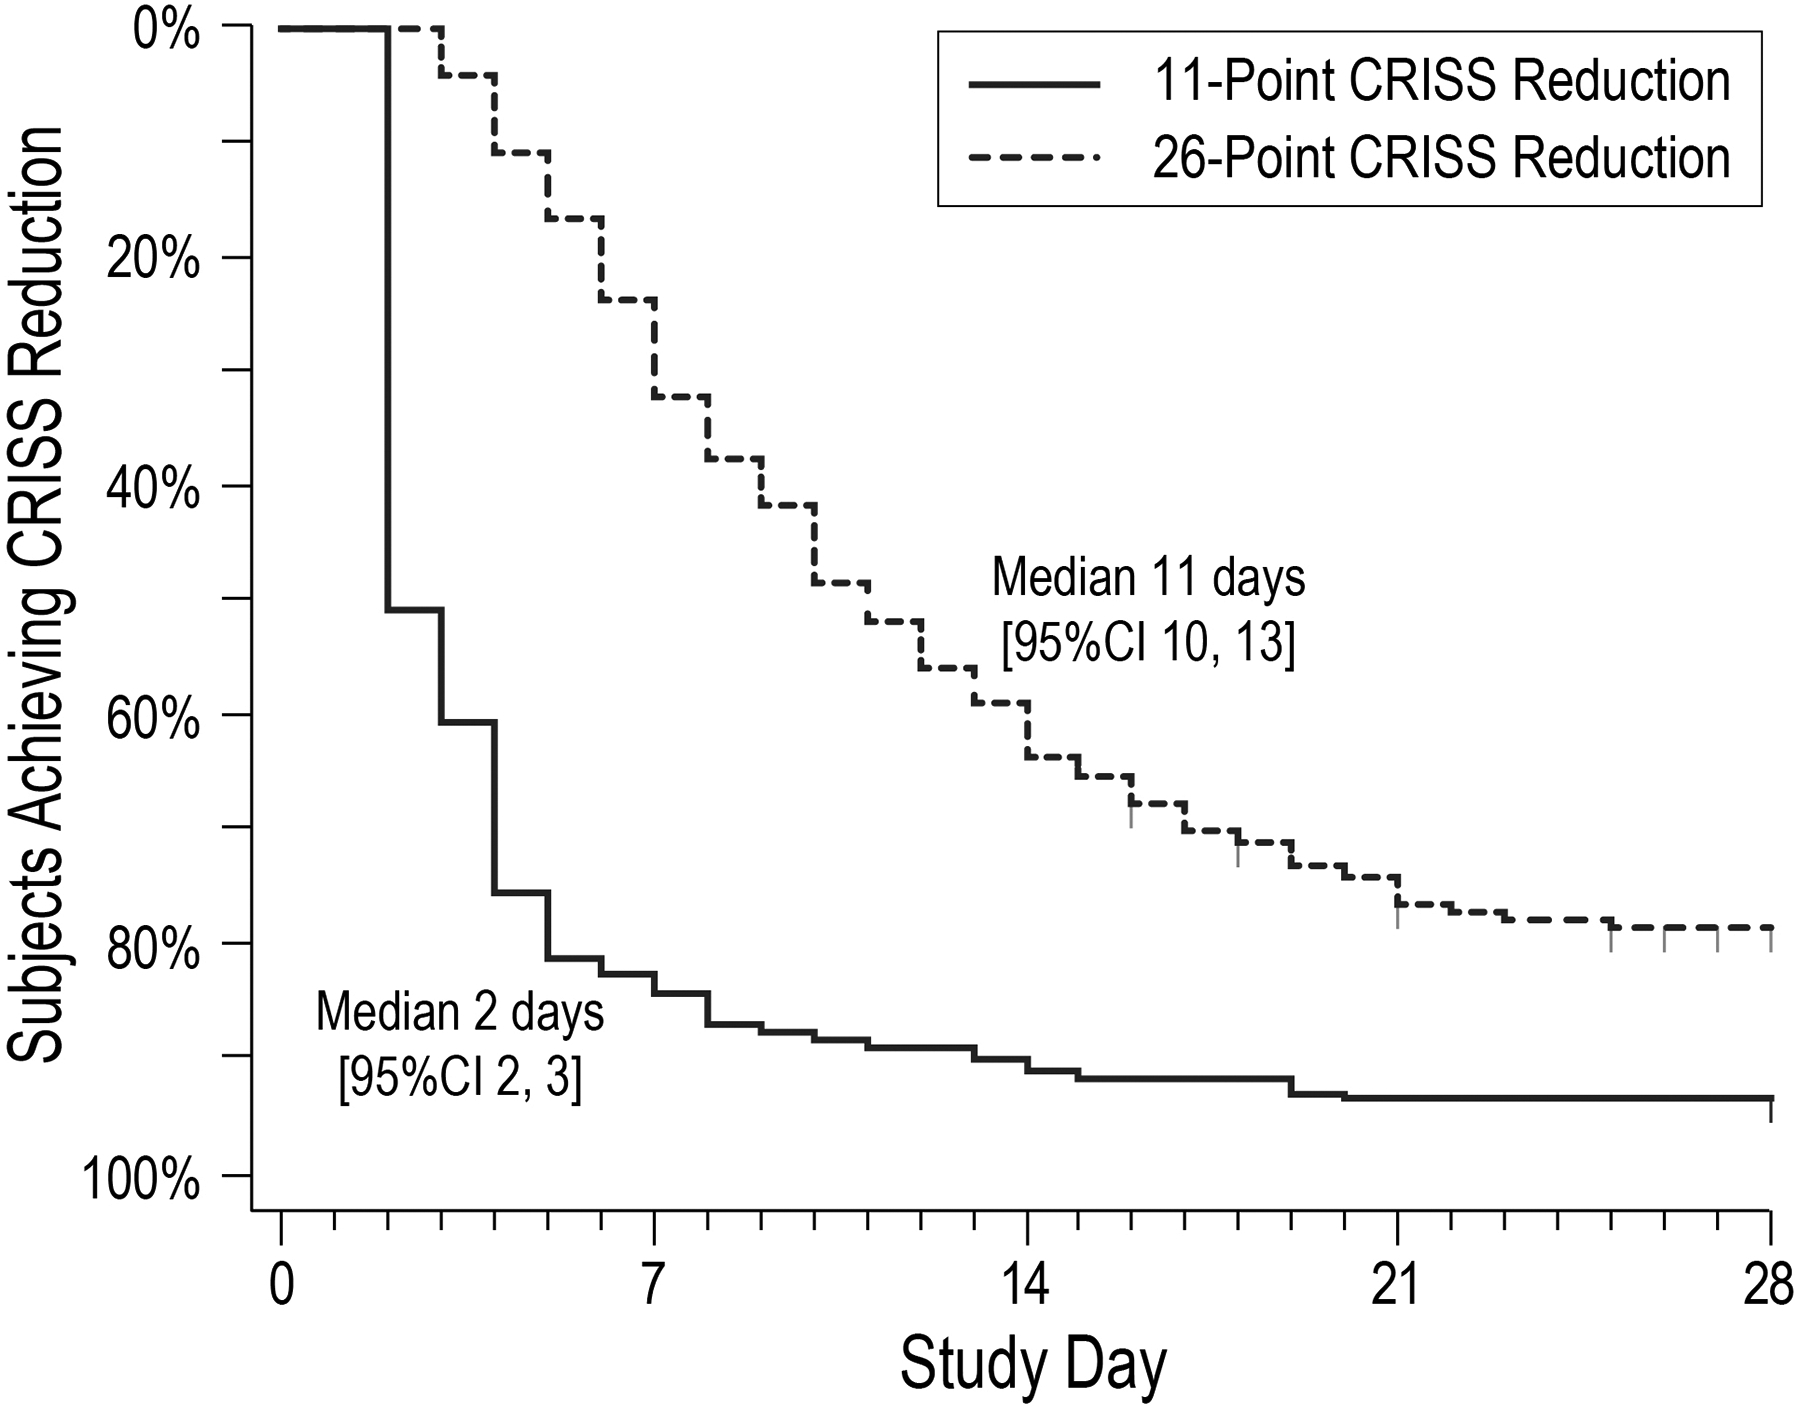
Figure 2. Kaplan Meier curves of time to achieving 11-point and 26-point CRISS reductions from baseline.

Time to an 11-point CRISS reduction from baseline is shown as a solid line; time to a 26-point reduction is shown as a hashed line.

Time to an 11-point CRISS reduction from baseline is shown as a solid line; time to a 26-point reduction is shown as a hashed line.