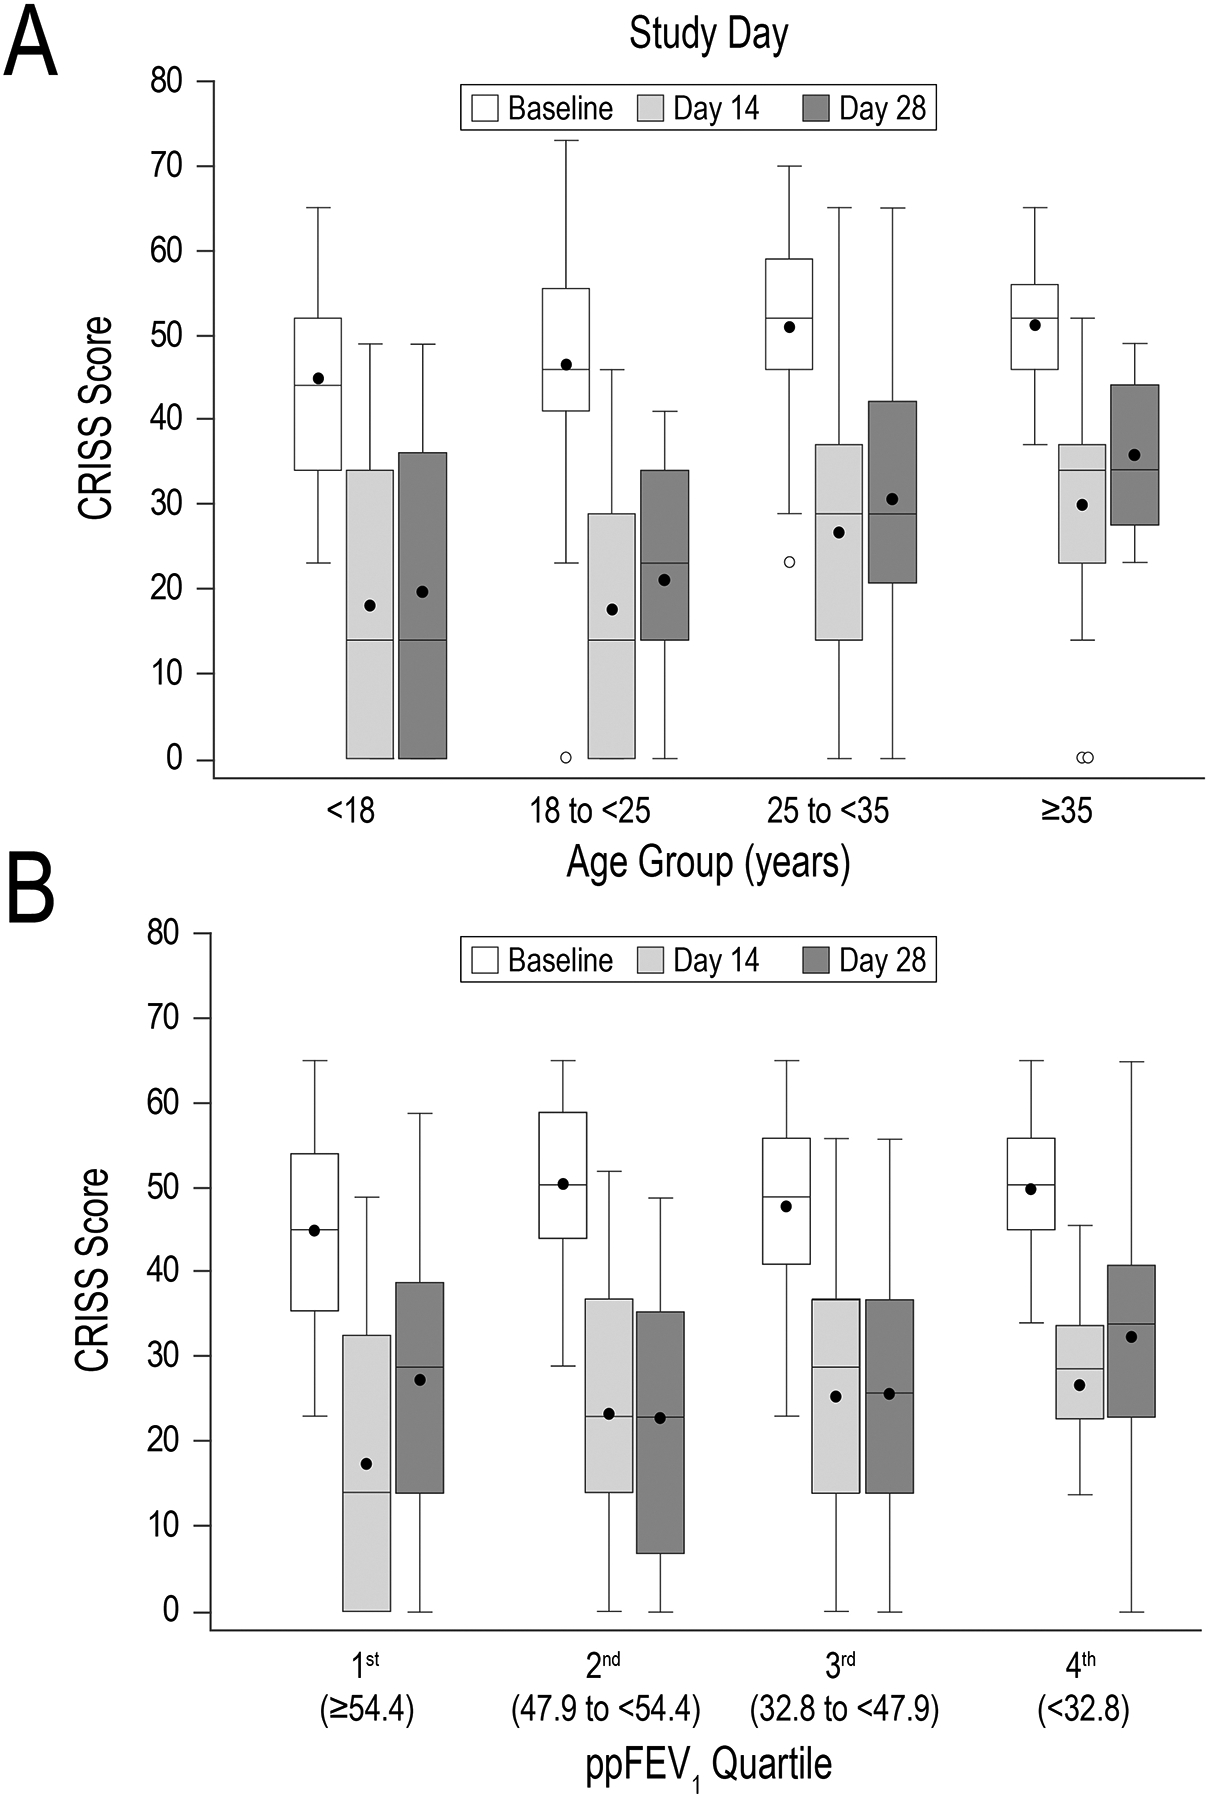
Figure 3. CRISS values at baseline, Day 14, and Day 28 stratified by age and lung function.

Panel A, box-and-whisker CRISS plots stratified by age group. Panel B, plots stratified by ppFEV1 quartiles. Boxes display medians and interquartile ranges, whiskers display ranges, solid circles display means, and open circles display outliers. White bars represent baseline values; light and dark gray boxes represent Day 14 and Day 28 values, respectively.
