
Figure 7.
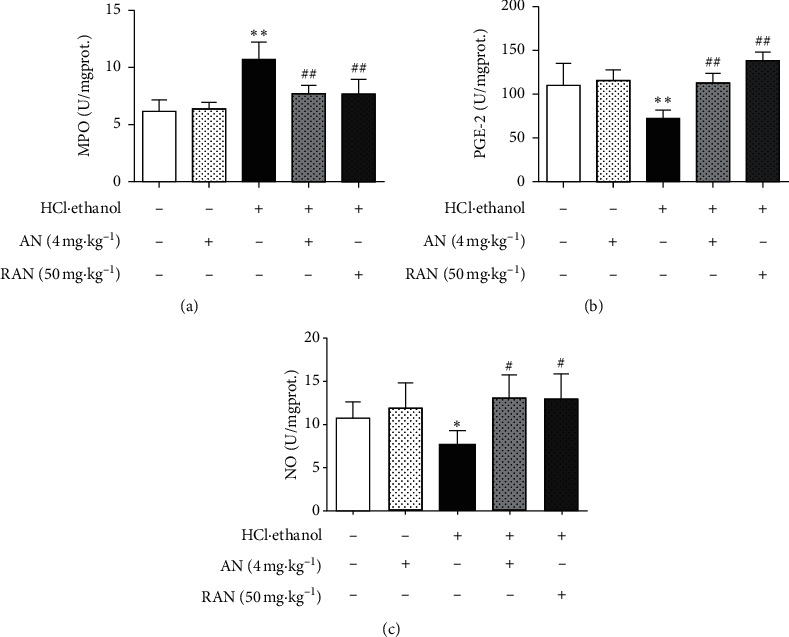
Effects of AN on the contents of MPO, NO, and PGE in the gastric tissues of mice treated with HCl/ethanol. (a) MPO activity. (b) PGE2 content. (c) NO content. The data are presented as mean ± SD (n = 8). ∗Compared with CON group, P < 0.05; ∗∗compared with CON group, P < 0.01; #compared with HCl/ethanol group, P < 0.05; ##compared with HCl/ethanol group, P < 0.01.