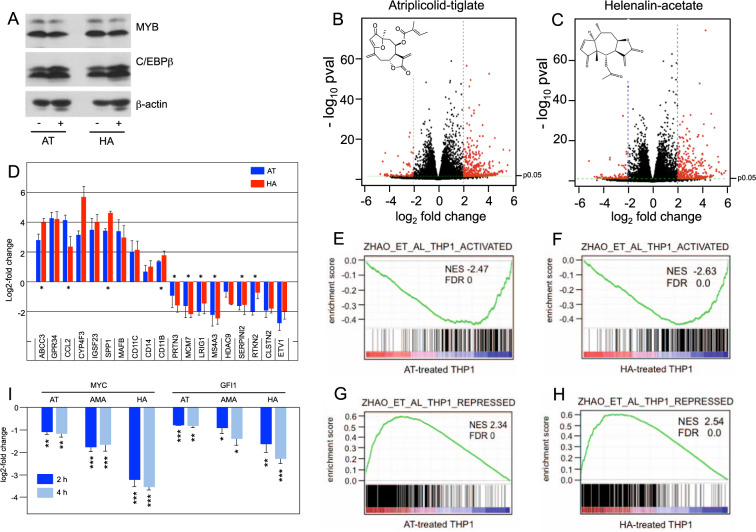
Fig. 5. RNA profiling of AT- and HA-treated THP1 cells.
A Western blot analysis of THP1 cells treated for 24 h without compound or with 1 μM AT or 0.5 μM HA. B, C Volcano plots showing gene expression changes (log2-fold change versus -log10 pval) of AT- and HA-treated THP1 cells. Genes up- or down-regulated four-fold or more (p < 0.05) are shown as red dots. D Real-time PCR of selected genes up- or down-regulated by AT or HA. Data are derived from three biological replicates. Bars indicate the log2-fold up- or down-regulation and standard deviation of the indicated genes. Known MYB-regulated genes are marked with asterisks. E–H GSEA of the AT- and HA-induced gene expression signature and genes repressed or activated by MYB in THP1 cells. I Decreased MYC and GFI1 expression in THP1 cells after treatment for 2 and 4 h with AT (1 μM), AMA (1 μM), or HA (0.5 μM). Asterisks indicate statistical significance (*p < 0.05, **p < 0.01, ***p < 0.001, Student’s t test).

