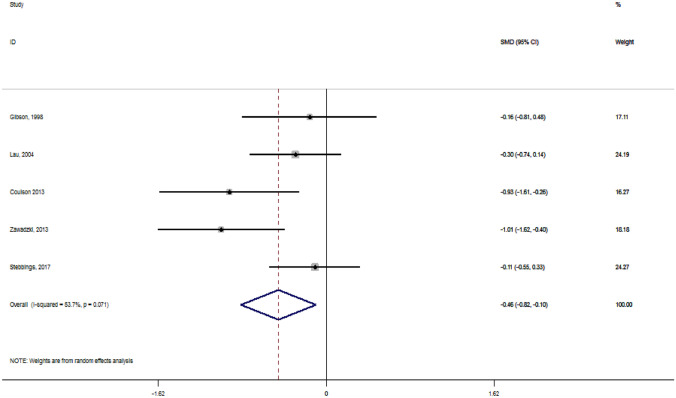
Fig. 2.
Forest plot displaying standard mean difference (SMD) and 95% confidence interval (CI) measuring the impact of GSM supplementation on VAS pain score. The black dots estimate the study result and give a representation of the size of the study. A horizontal line representing the 95% confidence intervals of the study result, with each end of the line representing the boundaries of the confidence interval. The diamond represents the effect size and confidence intervals that combines all the individual studies together

