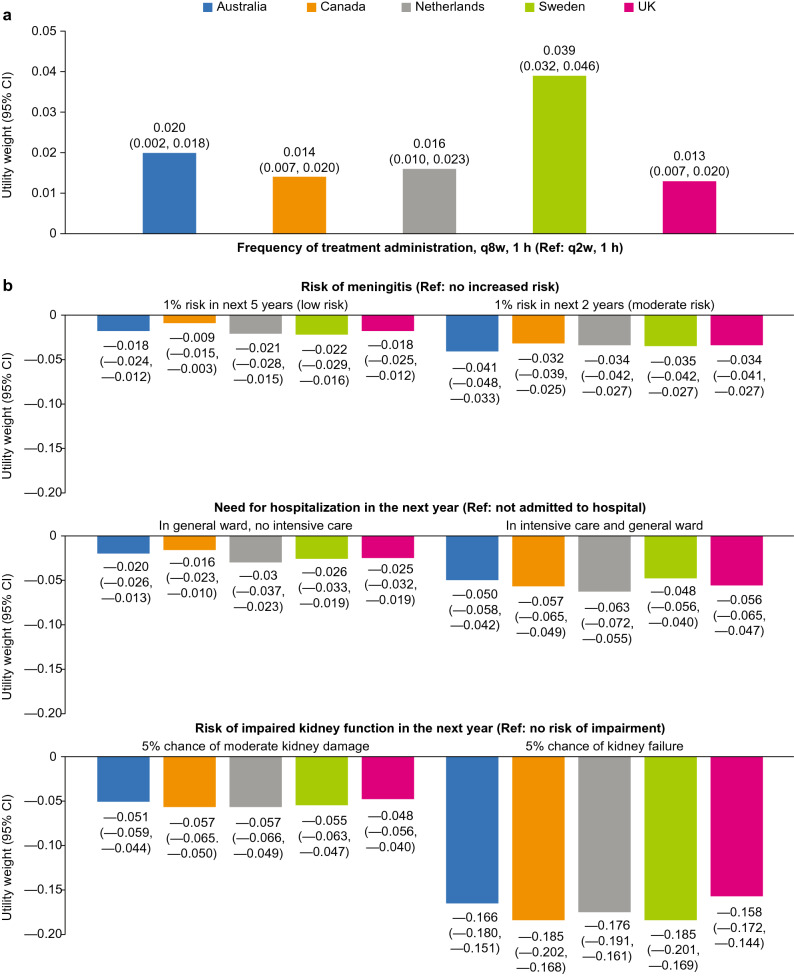
Fig. 2.
Estimate utilities (a) and disutilities (b) for differences in attribute levels. Utility weights were calculated by dividing the marginal rates of substitution estimates for each attribute level by the estimated remaining life expectancy per country. For example, in the UK, the marginal rates of substitution value for a 5% chance of kidney failure was 5.340 (assuming average life expectancy). The estimated remaining life expectancy of the UK sample was 33.8 years. The utility weight associated with a 5% chance of kidney failure is therefore estimated as 5.34/33.8 = −0.158 (negative figure indicates disutility). CI confidence interval, q2w every 2 weeks, q8w every 8 weeks, Ref reference level

