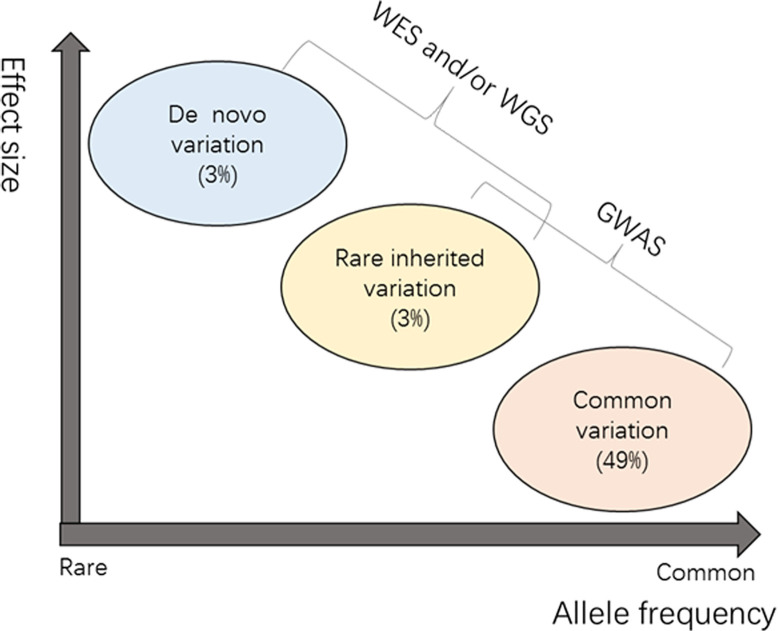
Figure 1. Genetic architecture of ASD.
This is a sketch map showing liabilities in three mutation classes, namely common variation (minor allele frequency (MAF) > 5%) and rare inherited variation (MAF < 1%) and de novo variation [4]. The x-axis represents the allele frequency from rare to common. The effect size is increasing from bottom to top. The liabilities in different mutation classes are shown in brackets.

